
The Impact of US Actions in Iran on Oil Prices and Stock Markets
#290 Update on US Indices, Top-20 US Stocks & Crude Oil Returning to $100-a-barrel.

Introduction
It is likely not a coincidence that the US government targeted another oil-producing country following its intervention in Venezuela. While the threat of an atomic bomb and supporting the Iranian people in their fight against tyranny may seem like valid concerns, I don’t believe that is the primary motive behind this action.
Upon reflection, it seems that the US’s interest in bringing Iran under its influence is more focused on securing crude oil and natural gas supplies, especially since 80% of these Iranian exports currently go to China. What will be the effect on crude oil and the stock market in the days and weeks ahead?
Crude Oil
As Iran is currently attacking tankers in the Strait of Hormuz, this could cause crude oil prices to reach $100 per barrel in the coming weeks. Based on OPIS (Oil Price Information Service) and EIA data1 as of early 2026, the Strait of Hormuz is the world’s most critical oil transit chokepoint, with roughly 20–30% of global seaborne oil trade passing through it. (Source: Strait of Hormuz Factsheet)

Any blockage of cargo ships or intense fighting might disrupt the supply chain, leading ships to take longer routes or preventing oil-producing countries in the region from exporting their products.
Currently, OPEC’s eight member countries plan to meet this Sunday to discuss increasing oil output to lessen supply chain disruptions in the energy market.
What do the cycles reveal? I have been watching the crude oil chart for several years, and it seems likely that crude oil will spike back to the levels seen in 2014, when it was around $100 to $110 a barrel.
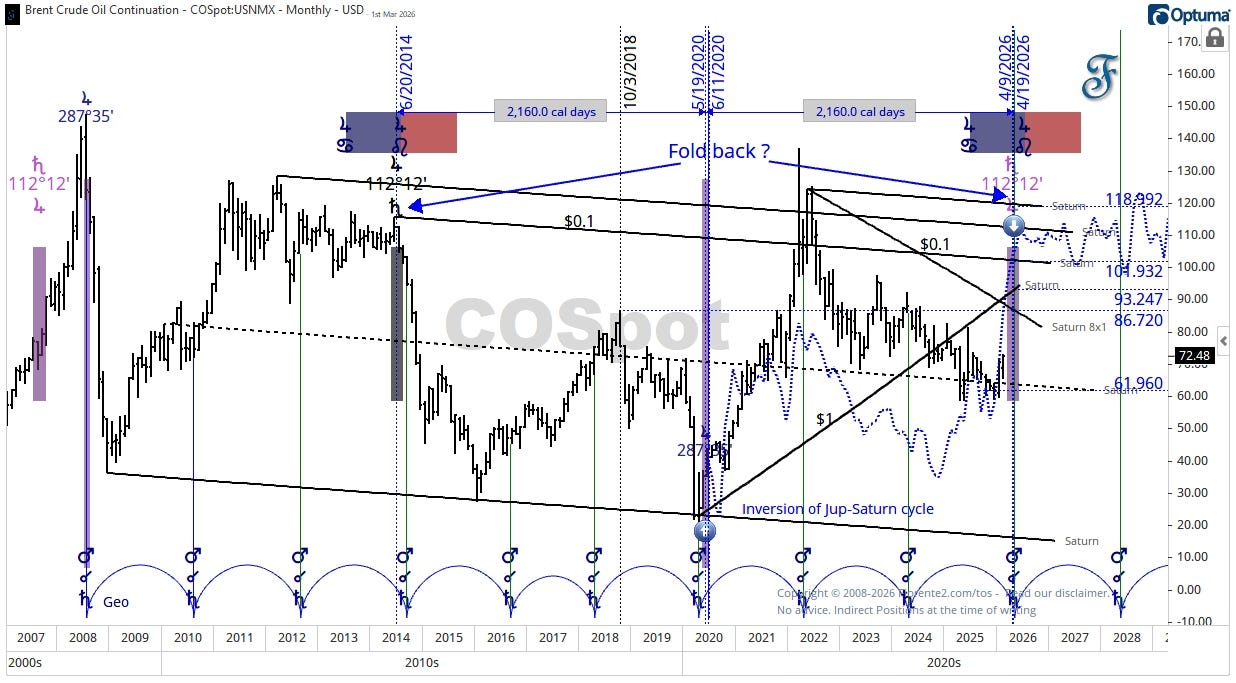
The Jupiter-Saturn cycle from a heliocentric view peaked about 12 years ago and is expected to return to the same point between February and May 2026, on an inversion of this cycle, as shown in the chart below. I expect Crude Oil to return to higher highs between now and May 2026.
The Mars-Saturn conjunction on April 19, 2026, may be a moment when we see a change in trend again. Measured with Saturn timing lines from past highs or lows, there is resistance at $86-$93-$100-$110-$119, so if this conflict continues and disrupts the energy markets, I can see these price levels reached in the next few weeks and months. This will certainly affect the price of gasoline at the pump we pay for as well.
Stock Market Impact
Crude oil and natural gas drive the global economy. These commodities are vital for major airlines and shipping companies like Maersk and Frontline (FRO), and to energy stocks already soaring toward a 12-year high. How this will impact the overall stock market and indices remains uncertain, as the futures market won’t open until late Sunday (US time).
With US indices already dropping from all-time highs, an intensified conflict with Iran could further increase the risk that the stock market can maintain these high levels.
So, let’s examine the main US indices and some relevant cycles that might be active, starting with the New York Stock Exchange Composite Index (NYA).
NYSE Composite (NYA)
The NYSE Composite reached a similar high exactly 60 years ago but has not yet followed this cycle with a decline. It seems more likely that the stock market will follow the 22-year cycle in a more phased decline until mid-August this year, or earlier, by the end of June, 15 degrees of Saturn Helio from the April 7th, 2025, low.
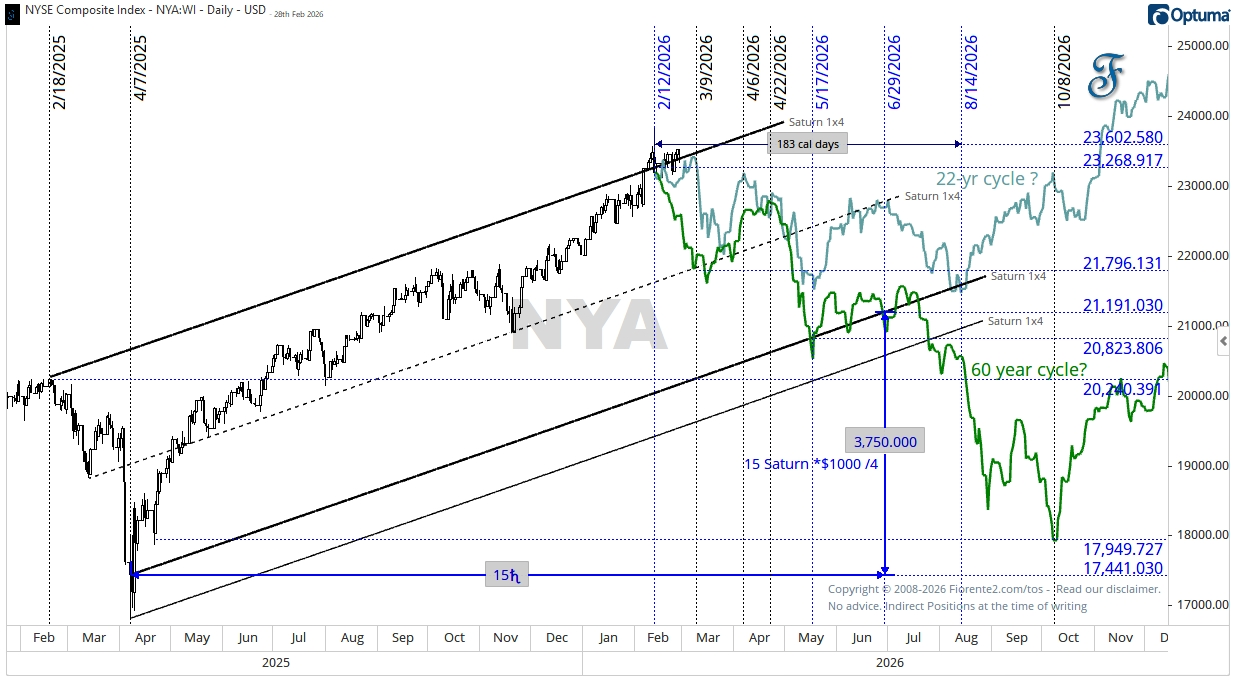
Note: the 22-year cycle is interesting as the USA was active in a conflict with Iraq, which is in the same region. This is why I have been following this cycle, earlier identified by George Lindsay in his ‘Aid To Timing’-thesis.
DJIA
A similar story can be mentioned for the DJIA. Note how the DJIA squared out on the high of early February already on a Saturn 1x2 timing line, on the same date as 60-years ago.
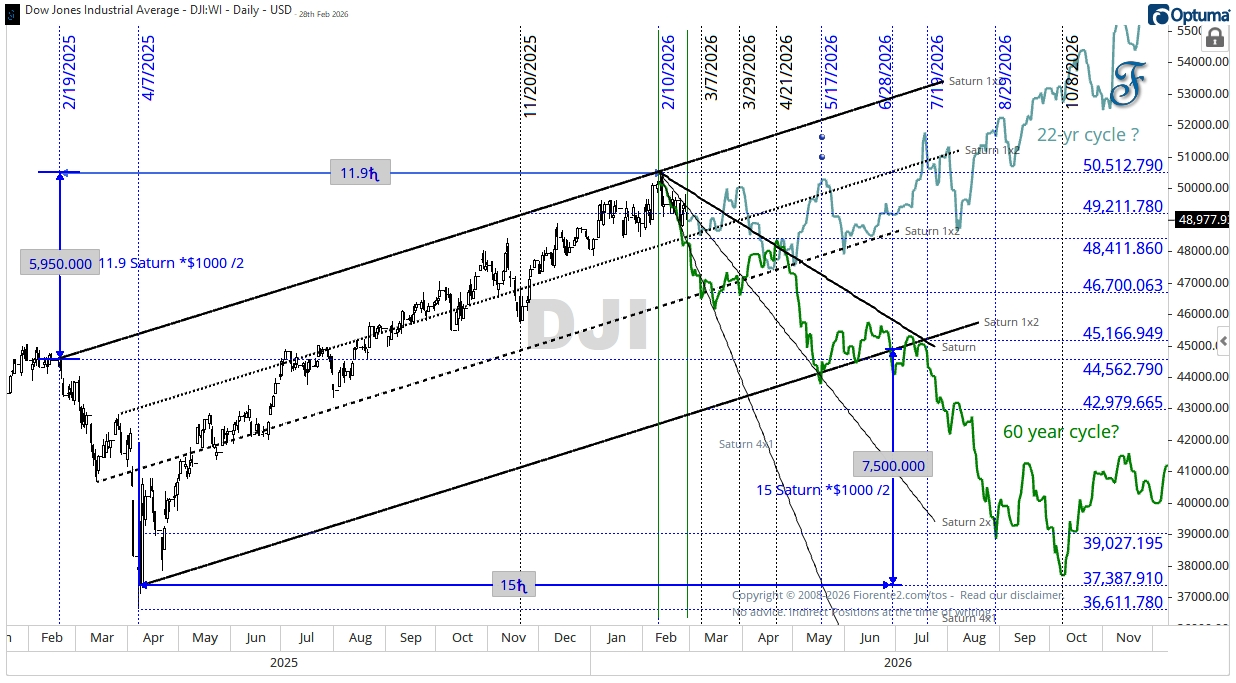
I honestly don’t know if the DJIA will follow the 60-year cycle or the 22-year cycle shown on the chart. I have no crystal ball. The themes of the past (such as tariffs, the Vietnam War 60 years ago, and the Iraq War 22 years ago) still apply, but the current situation may differ slightly. We’ll have to see how the current conflict develops.
There are other cycles as well that still point to highs around mid-2026, which I will show at the end of this post.
S&P 500
I prepared a similar chart for the S&P 500 using the Saturn timing lines from past highs and lows. The S&P 500 seems to be declining into a low by mid-March 2026 on a first leg downwards, perhaps following the 60- or 22-year cycle. Roughly, they follow a similar direction for some time.
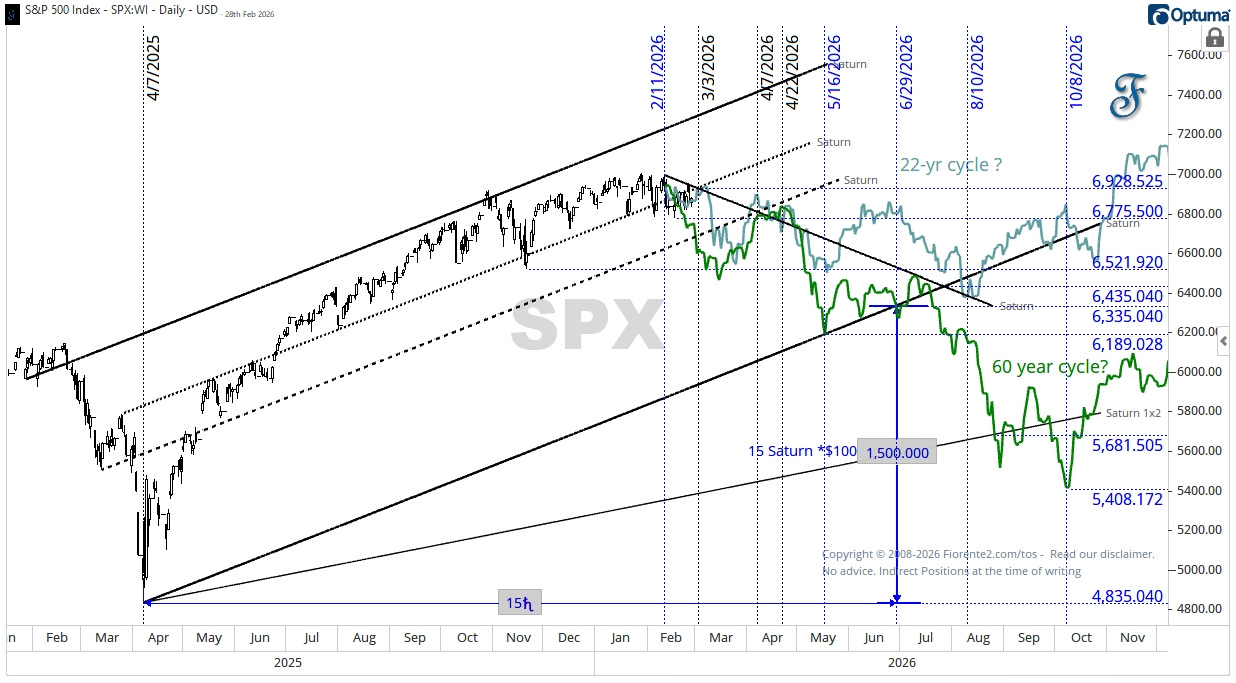
My bias for this year is the repeat of the 22-year cycle. The economy is resilient, and if the current actions in Iran end as favorably as 22 years ago, we may see the S&P 500 (and the other US Indices) bounce off the lower Saturn timing lines. Price levels may vary by index.
Nasdaq 100
The Nasdaq was not around 60-years ago, so I plotted only the 22-year cycle on the chart below. I have added a Saturn-Planetary Fan from the recent high in January that might give an idea of where the index may be heading if the downtrend continues.
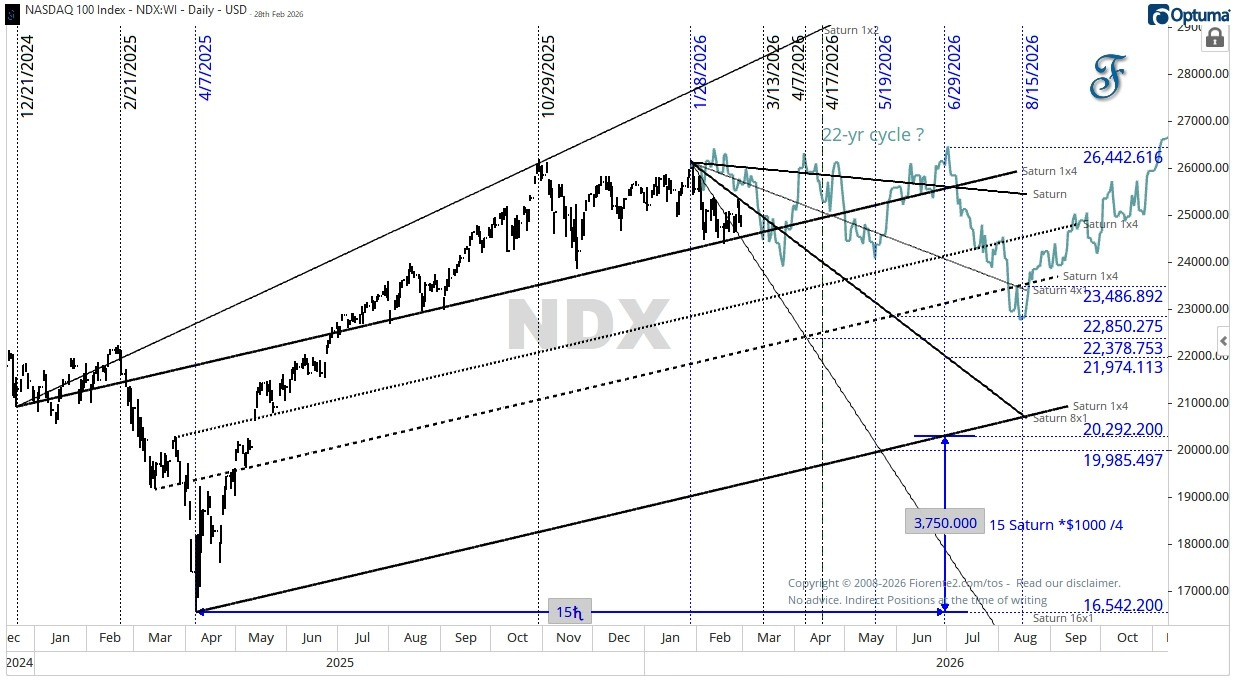
When panic takes hold of investors, I can imagine the Nasdaq declining to the mid-channel timing line (dashed), or even lower, with similar volatility as the other US indices, to the Saturn 1x4 timing line. Even if the index ends up as low as around 20k, the overall bullish long-term trend remains intact.
Multiple Cycles
When considering other cycles that may be at work, I posted the DJIA chart (updated) below in previous posts.
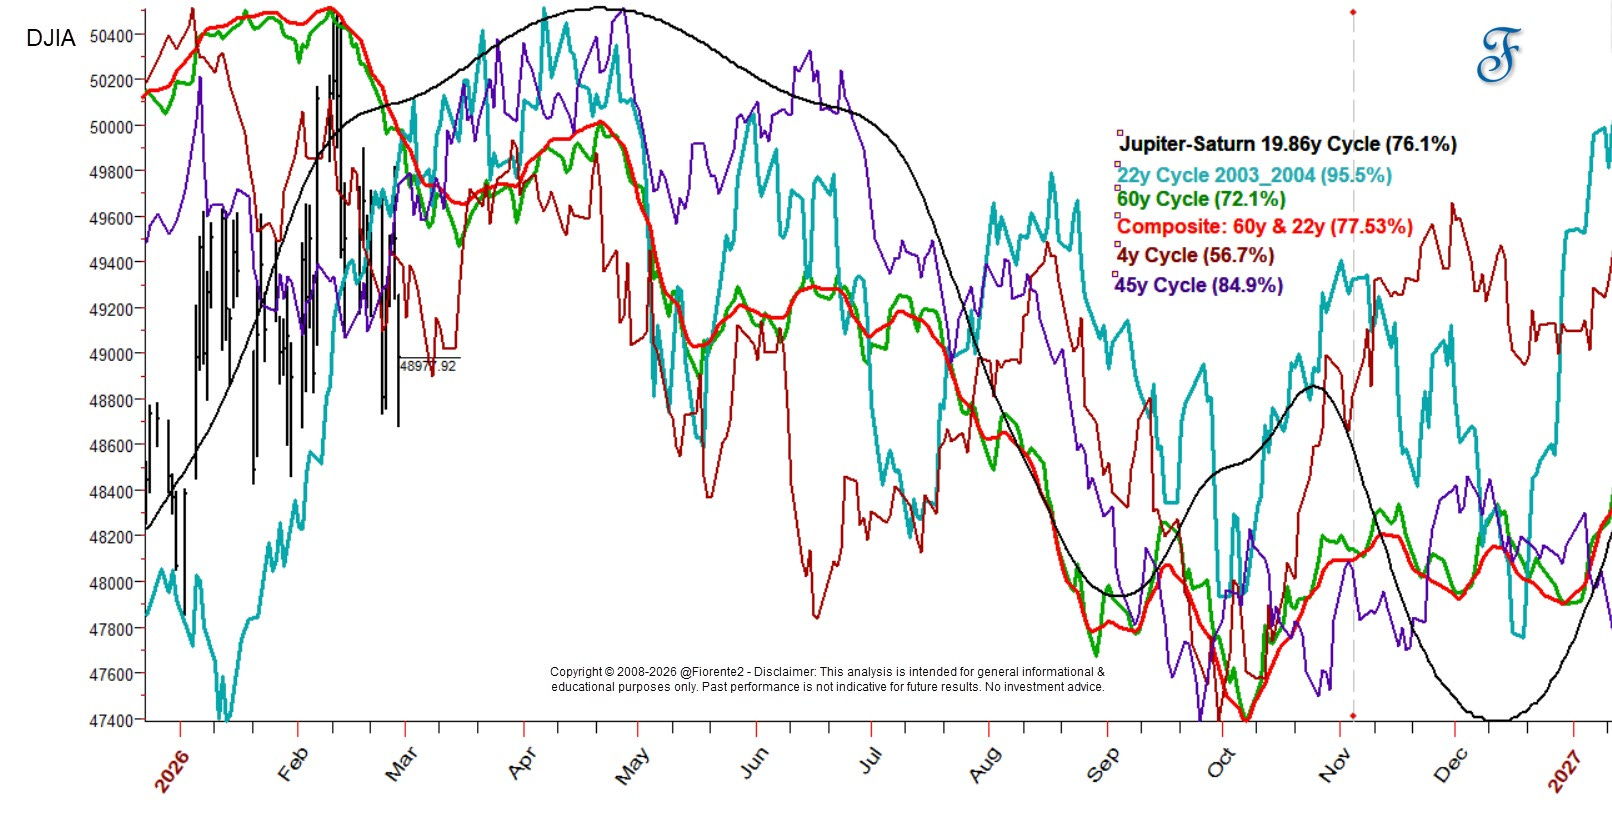
You can see on this chart that other cycles share one common factor: a low is expected in the third quarter of 2026, but their downward paths may begin earlier or later this year. So, be careful about concluding that a downward trend has already started based only on the 60- or 22-year cycle. It may even take until May-June 2026 to complete the topping process.
Top-20 US Stocks
From a Top-20 US Stock perspective the majority of the stocks that drives the US Indices most seem to be fundamentally or technically overbought which adds to the my hypothesis there is enough reason to believe the US Indices could seek lower lows.
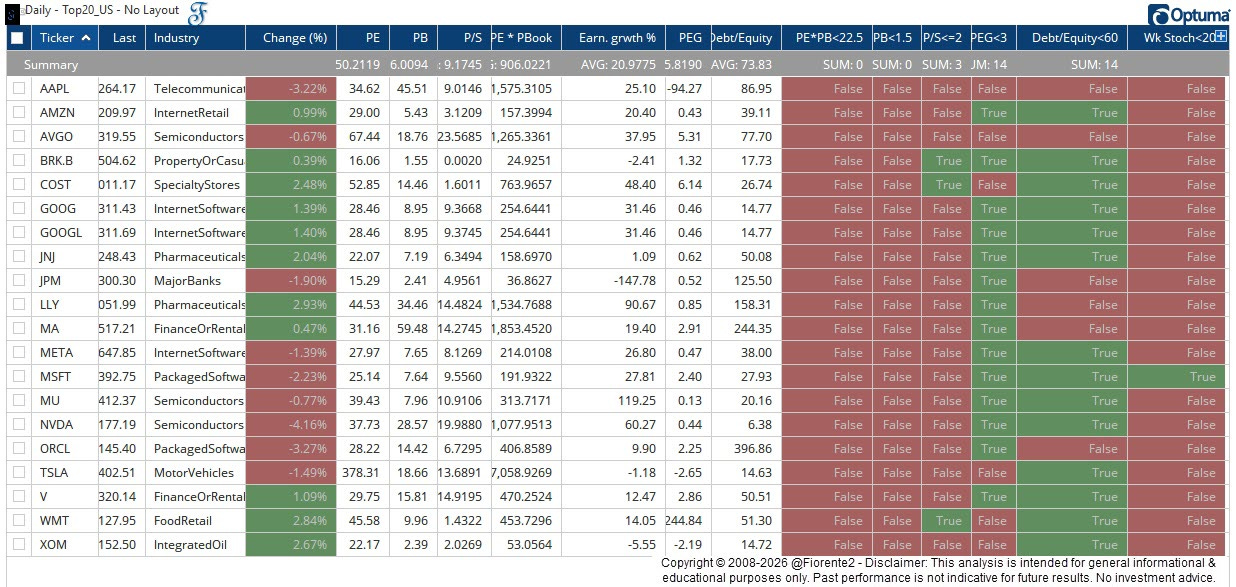
Based on sound fundamental or technical criteria, I would like to see lower Price-Earnings Ratios (PE), Price-Book (PB), or Price-Sales (P/S) ratios. For a rebound, I would prefer the weekly slow Stochastic indicator (last column) to be below 20 and preferably forming a higher low before considering taking any additional positions in these stocks.
Conclusion
My outlook in this post suggests we may see significant volatility in both oil markets and equities in the weeks and months ahead. As mentioned before, I have no crystal ball, and it is hard to forecast how the financial markets will react to the attack on Iran.
On crude oil, I expect quite a bit of volatility and a return to the $100-a-barrel price level, or even higher, if the conflict continues. OPEC might try to intervene by dumping more crude oil into the market to maintain reasonable price levels.
How the futures will react to the current USA mission remains to be seen overnight. With a successful US mission, the markets may respond cautiously. If panic grips investors when the Asian markets open on Monday, late Sunday night (US time) due to supply chain disruptions, we could see significant volatility across global indices.
At times like this, I stay out of the markets and will see what happens. When volatility subsides, we may see some good opportunities to take new positions.
This is my current bias on crude oil and across the US indices. Remember, cycles can contract, extend, and invert. I may be wrong, of course. Anomalies can occur, fundamentals can shift, so be cautious. I expect some significant volatility ahead.
In case you haven’t noticed, I post various charts in the Substack notes every week. You can find them all here. (click on the link)
P.S.: Occasionally, I share new analyses exclusively for free subscribers. Subscribing gives you email updates on these posts, plus extra insights and deeper research from the time you join onward; past analyses are not included.
If you liked this post from @Fiorente2’s Blog, why not restack and share it?
© 2008–2026 Fiorente2.com. All Rights Reserved.
Disclaimer: This analysis is for informational and educational purposes only and should not be considered investment advice. Read our full disclaimer.
Disclosure: From time to time, I may hold positions in the securities mentioned.
US Energy Information Administration