
The 71-year Cycle and inflation fears
#176 An update on the US Indices: DJIA, S&P500, Nasdaq Composite

Introduction
The Producer Price Index (PPI) experienced a greater-than-expected annual rise in February, marking the largest increase since last September. An increase in the PPI may lead to a rise in consumer prices of goods and services, although other factors also play a role in determining prices. Over the past few years, consumers have already witnessed an increase in the costs of living, including groceries, housing, and energy. As a result, inflation remains a concern. Is history repeating?
The DJIA's closest cycle in 2023 has been the 71-year cycle, which is nearly twice the Saturn-Neptune Helio cycle (35.85 years). In astrology, Neptune rules over inflation, while Saturn governs recession, falling profits, poverty, unemployment, and scarcity.
In 1953, the United States faced a recession, which lasted from the second quarter of that year until the first quarter of 1954. The Federal Reserve tightened monetary policy in 1952 due to concerns about further inflation or the potential formation of a bubble. Historically, there was a recession from August of 1904 until August of that year, as well as in 1918, 1883, and 1848. All were approximately 35/36 years apart, with the exception of 1988/1989.
Currently, there seems to be a pattern of a 71-year cycle that keeps repeating itself. Despite the Federal Reserve's attempts to control inflation, I am taking into account this 71-year cycle. The chart below illustrates the events that took place in the DJIA during 1953-1954, overlaid on the current DJIA chart, which is 71 years later.
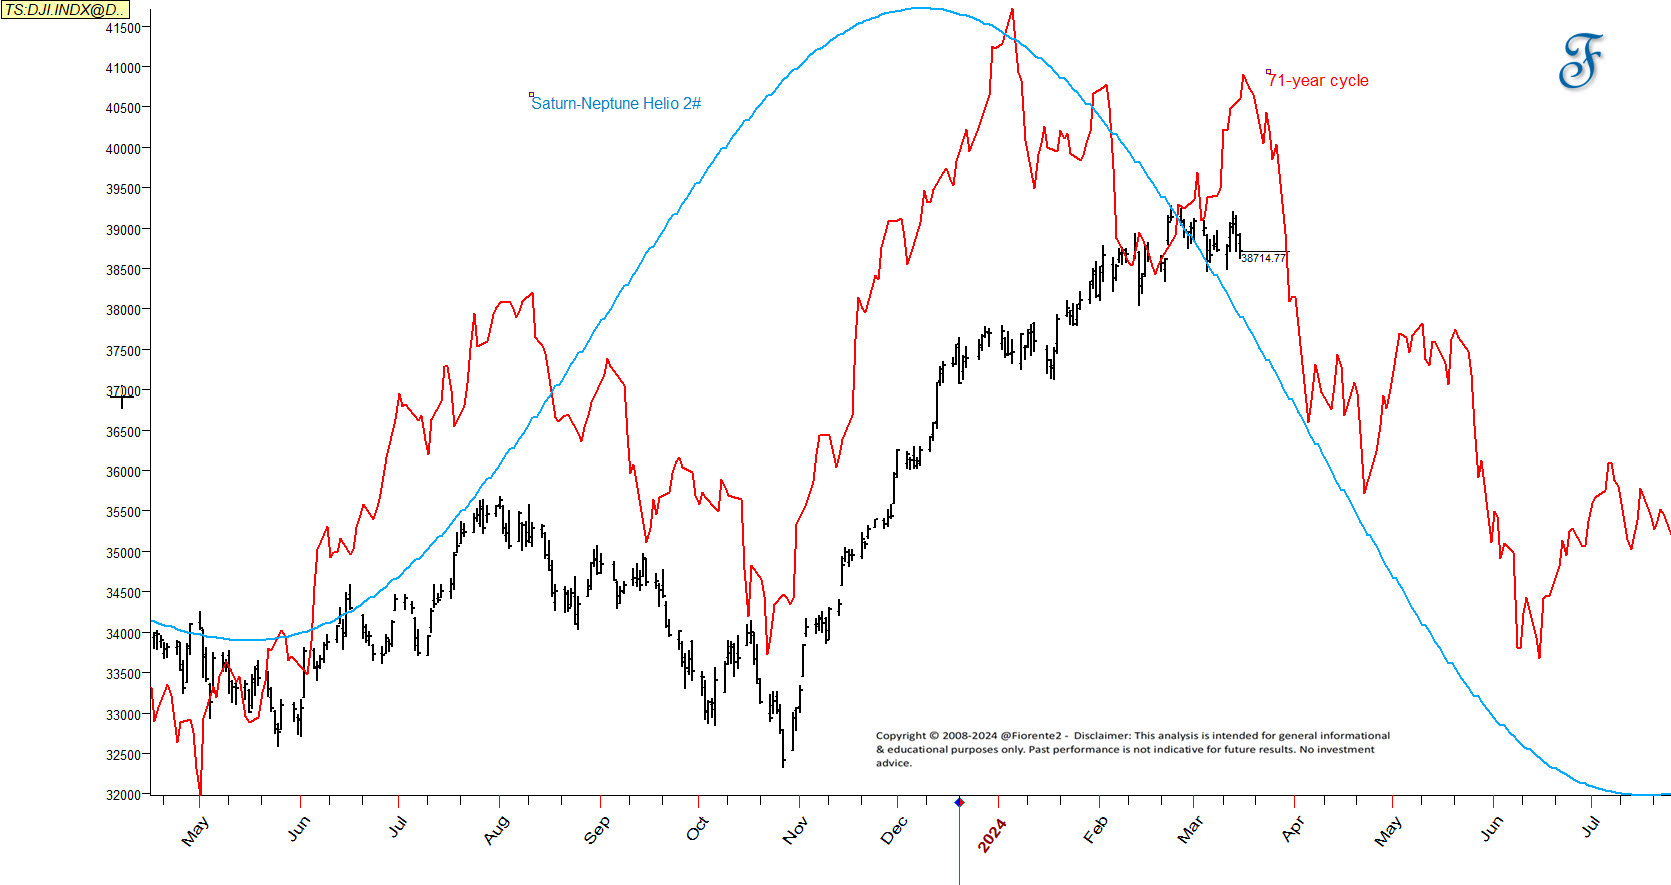
I alose overlaid the second harmonic of the Saturn-Neptune heliocycle on the chart above. Please note that the amplitude of both the 71-year and Saturn-Neptune cycles does not imply the same amplitude as the DJIA price curve.
Although this 71-year cycle has an 80% correlation with today's market, please note that any comparison with early years may stop working.
Although the economy may still be performing well due to delayed spending after the COVID-19 pandemic, consumers are beginning to feel the impact of inflation on their daily expenses, such as the rising costs of groceries and housing. This may eventually have an adverse effect on the economy, and a downturn in the stock market may likely follow. This may happen suddenly.