
The 7-Year Cycle
#279 Latest Insights on US Indices and Key Trends in various Top 20 US Stocks

Introduction
US Indices are close to a 7-year high, dating back to October 5th, 2018. They're also near the same planetary alignment, with the Sun in Opposition to Saturn, which triggered the low in the US indices in March 2009 to reverse the trend. Several other cycles are clustering around the same time.
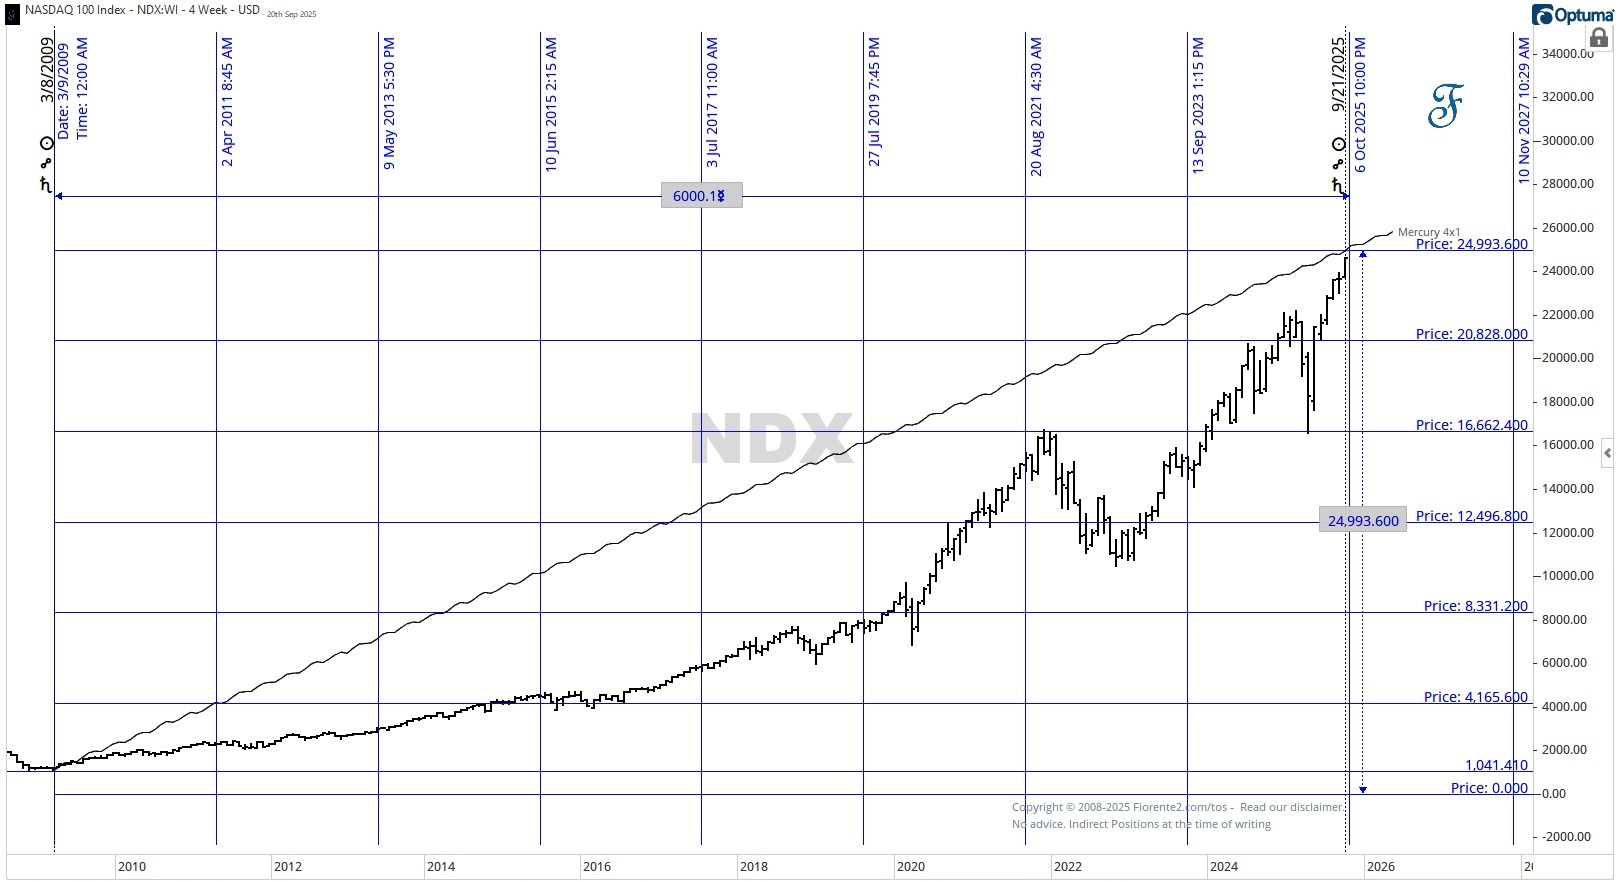
In terms of time (Geocentric longitude), Mercury moved approximately 6,000 degrees since the low of March 2009, and in price, 24,000, which corresponds to the 4x1 timing line I showed in the above chart. Note: I have used 4 times the low of 1,041.41 as the price increment, which clearly shows where past support and resistance were found.
BTW: Mercury moved 24,801 in heliocentric longitude, which is almost a 1x1 timing line by early October 2025.
The harmonics in price and time indicate that the US Indices may be approaching an important inflection point.
Similar price and time charts can be created for the S&P 500 and the DJIA, which I will share with premium subscribers in this week’s post. Next to the 7-year cycle, I will show how a 56-month, 45-month, and 18-month cycle may align with the 7-year cycle high, which is expected by early October 2025.
Additionally, in this post, I have updated the 60-year Gann Master Cycle Chart for the DJIA and the S&P 500, and provided an update on the top 20 US stocks that show similar inflection points in the next few weeks.