
The 60-year cycle revisited -part 2
#293 Update on the DJIA following the 60-year cycle and Top-20 US Stocks

Introduction
Last week, I showed readers that the U.S. indices are approaching an important inflection point based on the 60-year cycle. In this week’s post, I will further elaborate on the 60-year nominal cycle that is based on 3 times the approximate 20-year Jupiter-Saturn cycle.
The 60-year parallel theme
The 60-year parallel themes connecting 1966 and 2026 focus on inflation and recession fears, as well as the impacts of war costs (Vietnam: 1966; Iran: 2026). Between 1962 and 1966, we saw the rise of technology stocks, which resurfaced in 2022-2026 with the AI boom, paving the way for the next level of automation.
If you create a table from 1792 (the start of the US Stock Exchange) to today and divide the 30-year Saturn cycle into 6 parts, you notice that similar years in the past, 60 years apart, tend to have similar themes. At least they rhyme. Even 120 years ago, you saw similar themes, like the rise of industrial stocks and panics.
This follows the ideas of W.D. Gann, who used a Hexagon chart to calculate future Price and Time inflection points based on Saturn’s cycle. Each Cube represents a part of the Zodiac, dividing it into 6 parts of 60 degrees. The idea is that similar parts of the Zodiac may reap a similar influence.
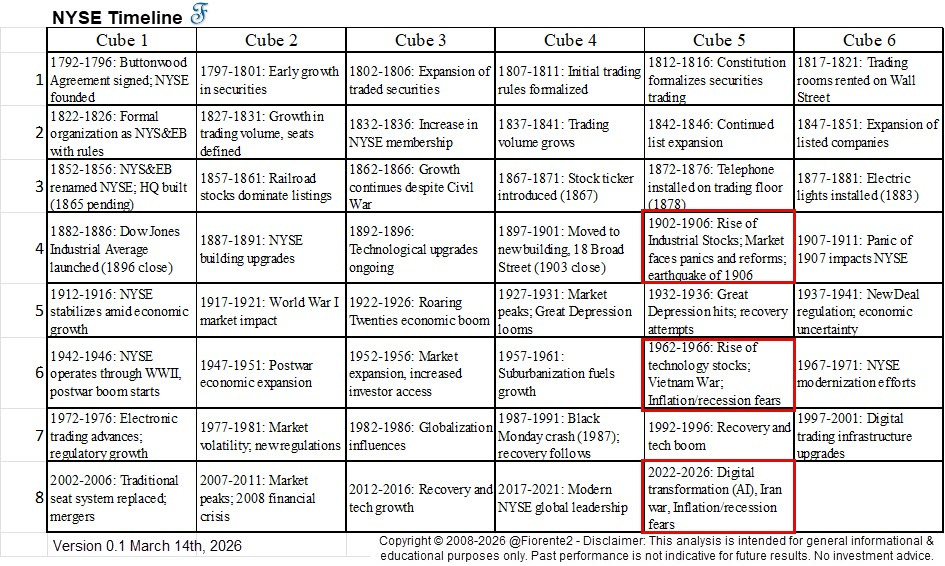
The above NYSE timeline is divided into six segments, each covering five years. Every row depicts a 30-year Saturn cycle. The five-year segments may also align with Jupiter, since 60 years, or two rows, can be divided into 12 five-year segments. Looking back 60 years, or two rows earlier, you might find that similar themes reappear in the current era. Hence, the above table shows what happened on the NYSE following both the Jupiter and Saturn cycles.
In 1966, the US political landscape experienced a major shift, with the Republican Party making a strong recovery after their severe defeats in 1964. Similarly, in 2026, a comparable shift might happen but in the reverse direction—from Republicans to Democrats. It is still unclear whether Democrats will win control of both the House and the Senate.
Note: By the end of 240 years (2027-2031), I expect the stock market to reach a major high, as it did in the early 1970s.
DJIA - Comparing 1966 with 2026
In 1966, the DJIA reached a high of around $1,000 on February 9th and a low of around $500 on October 10th. In green, I have overlaid the 2026 decline, so far from the February 9th,2026 crest, plotted from the February 1966 crest—a rather similar decline in percentage.
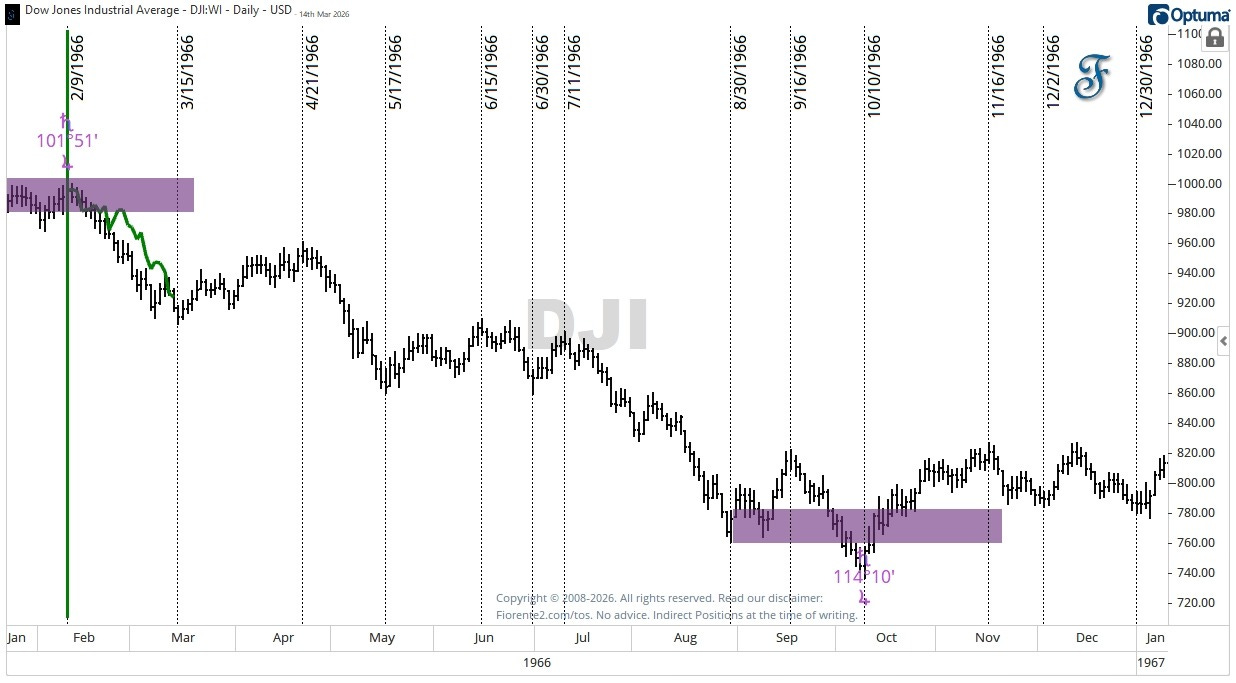
In the chart above, I have dated and marked the important inflection points.
I will show you in the charts below that, following Saturn’s planetary steps from the 1966 January-February highs and the 1966 October low, even after 60 years, this still yields significant future inflection points.
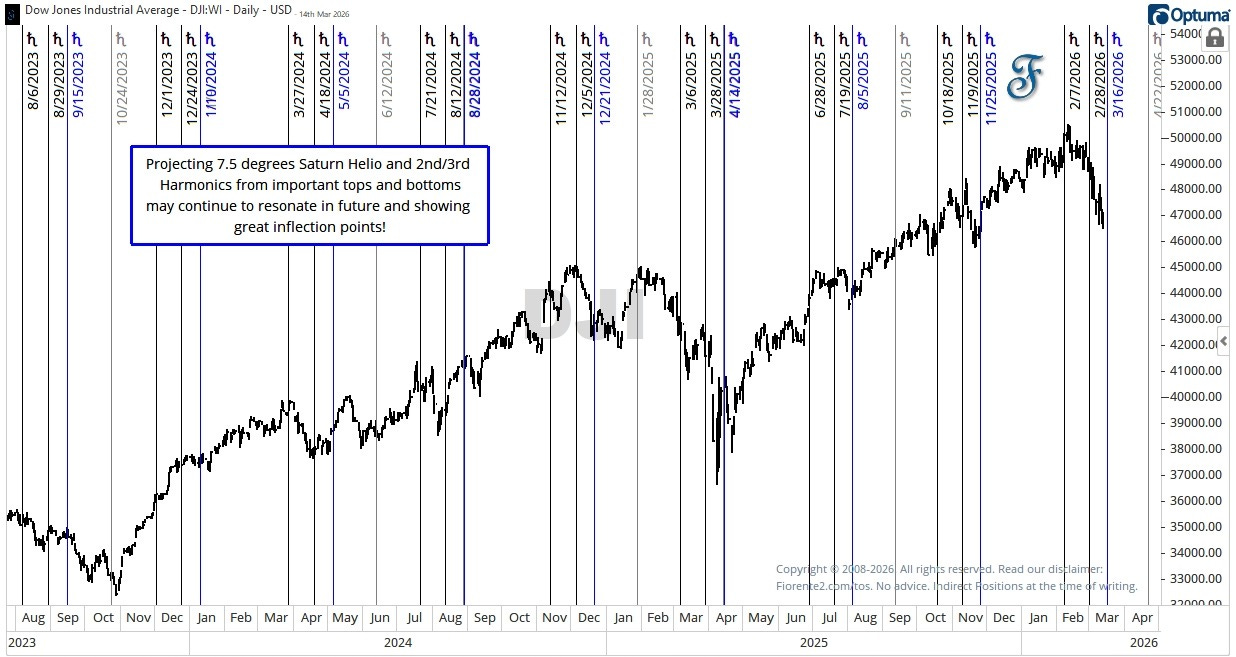
Each date in the chart above is connected to the 1966 January and February highs (black/grey) or the 1966 low (blue). This follows a 7.5-degree sequence of Saturn Helio. Even after 60-years the market still resonates on what happened so many degrees of Saturn ago.
DJIA - Planetary Time Clusters
Does the recent decline align with todays planetary constellations, transits, and geometries?
In the chart below, I have plotted the cumulative hard aspects (0, 90, 180 degrees) of planetary transits and included planetary geometries. This illustrates the Time Cycle Clusters at the bottom of the chart, where the highest volatility and market activity are expected.
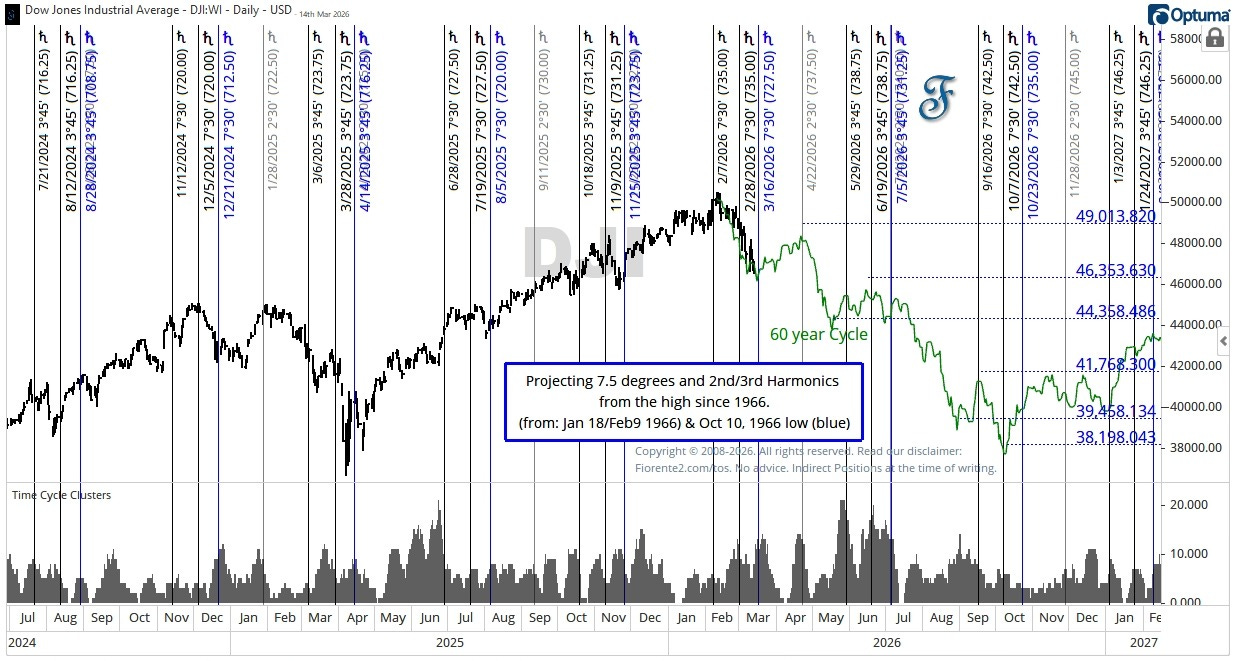
I have plotted the 60-year cycle from the same calendar day as 60 years ago (February 9th) in green, and we may be close to an inflection point, provided the DJIA continues to follow this same pattern as seen 60 years ago. Even after 60 years, there is an interesting similarity between the 1966 and 2026 inflection points.
Zooming in on the same chart and time clusters, you can see that an increase in Time Clusters, hard planetary aspects, often causes a decrease in price over time. A decrease in time clusters may often cause an increase in Price. You can follow the Price and Time Clusters’ divergence in the chart below.
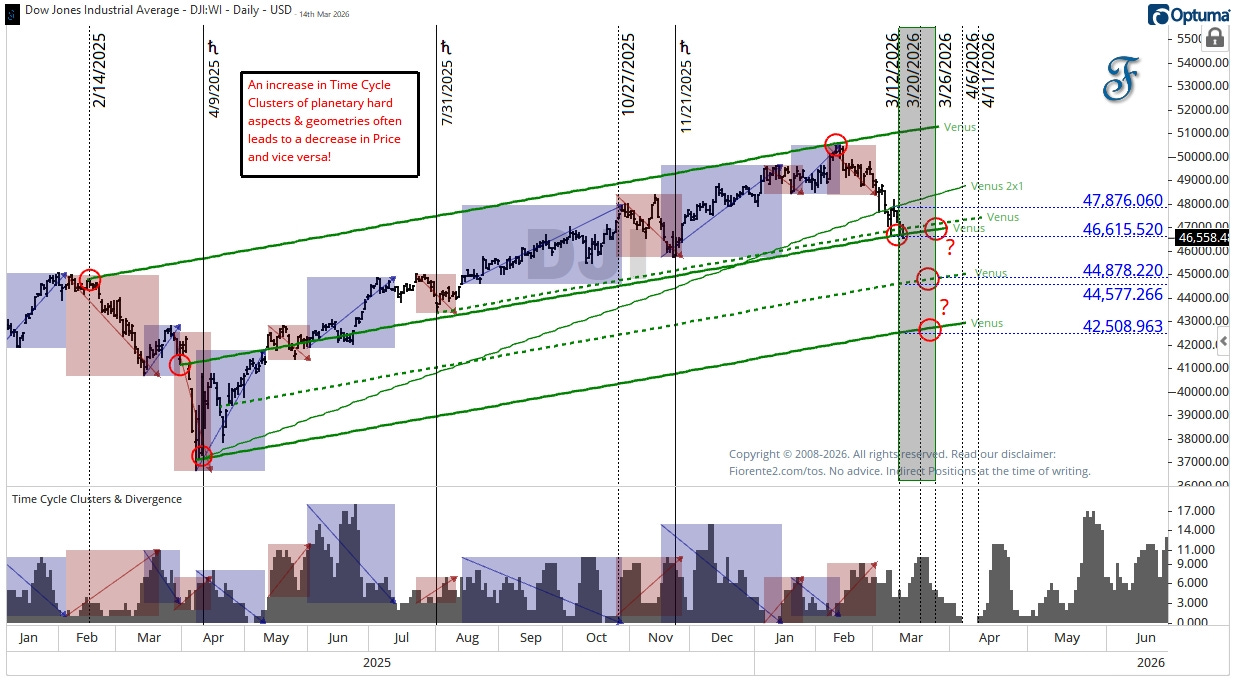
The chart above shows that the increase in hard aspects through the end of March suggests the recent decline may not be over yet. Plotting Venus Helio planetary lines from key highs and lows also indicates that the DJIA’s recent price levels found support at a Venus Helio planetary line.
The DJIA might stay at its current level through the end of March, or it could drop to the next level. We’ll have to see how the market reacts. After March, I see the hard aspects decline into Easter, which may support some recovery. After Easter, I see the hard aspects increasing again.
DJIA - Jupiter Saturn Cycle
Following 3 times the Jupiter-Saturn cycle from the October 1966 low, May 2026 aligns with the October 1966 trough. This may be a high or a low, but given that the second Jupiter-Saturn cycle was around the high, the probability favors a low for May 2026.

The Jupiter-Saturn synodic cycle, starting from the lows of October 10th, 1966, in 90-degree steps, lines up with the high in 2007, just 13 days before the October 10th, 2007, high. Mapping the third segment of this cycle ends on May 20th, 2026, which is 18 years and 7 months after the 2007 highs. This represents 1080 degrees, or three times 360 degrees, of Jupiter-Saturn motion from the October 1966 low.
Note in the above chart that from 2018 onward, the crests in 2021, early 2022, and February 2026 align with a Jupiter planetary line drawn from these peaks. If history repeats, as in 2022, a high for now was probably reached by early February 2026, and we may see a probable trough somewhere between April and July 2026. Jupiter and Saturn planetary lines may provide future support or resistance,
As shown earlier, the recent decline may be only the first leg in a larger decline similar to the 1966 decline, but it may be too early to tell. The economy is resilient, and a sudden end to the Middle East crisis and Oil crisis may turn investors bullish again, which could result in a possible second top in the April-June window. My current bias is that the crest has been set, but cycles can invert.
Top-20 US Stocks
From a Top-20 US Stock perspective, most of the stocks that drive the US Indices appear fundamentally or technically overbought, which supports my hypothesis that there is reason to believe the US Indices could seek lower lows.
Some stocks, like MSFT, Oracle, TSLA, and JPM, show a Slow Stochastic (25,3,3) smaller than 20 on a weekly scale, which could signal they may have found an intermediate bottom for now. But such a signal should always be confirmed with other indicators.
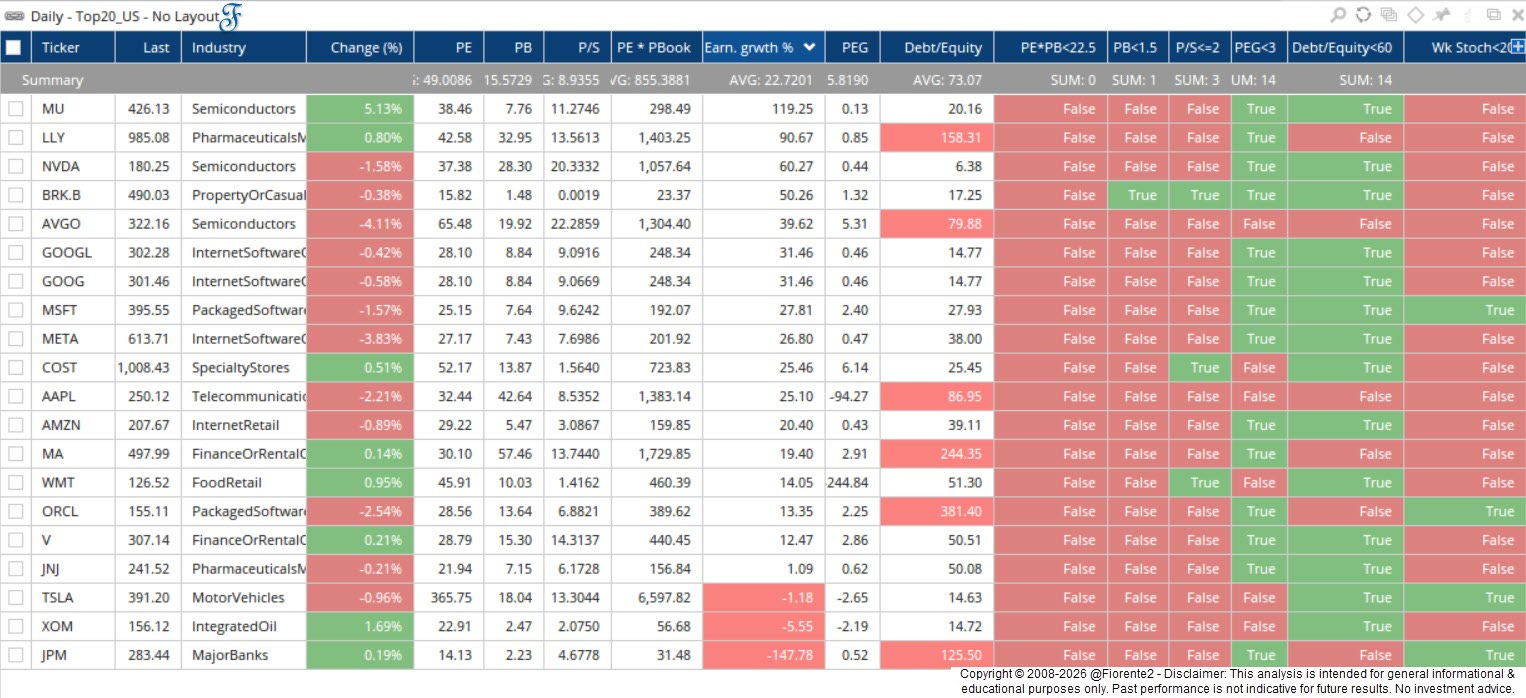
Berkshire Hathaway (BRK.B) may be the only stock that is close to a fair value, although Buffett only bought back his stocks in the past when his Price Book value was close to 1.2
Based on sound fundamental or technical criteria, I would like to see lower Price-Earnings Ratios (PE), Price-Book (PB), or Price-Sales (P/S) ratios. For a rebound, I would prefer the weekly slow Stochastic indicator (last column) to be below 20, preferably forming a higher low, before considering taking any additional positions in these stocks.
Conclusion
In this post, we have followed the nominal 60-year cycle, which is equivalent to 3 times the Jupiter-Saturn synodic cycle. I have projected this from the 1966 October low.
The second instance of the Jupiter-Saturn cycle made a high just 13 days before the actual high in 2007. Hereafter, three 90-degree increments aligned with the end of 2021, early 2022 (within a few degrees). The last 90-degree increment completes 3 times the Jupiter-Saturn cycle around May 20th, 2026.
My bias for now is that this aligns with a low around this date; give it a 1-month window on either side. However, as mentioned earlier, the economy is resilient, and a sudden end to the Middle East crisis and Oil crisis may turn investors bullish again, which could result in a possible second top in the April-June window.
At times like this, I stay out of the markets and will see what happens. When volatility subsides, we may see some good opportunities to take new positions.
Remember, cycles can contract, extend, and invert. I may be wrong, of course. Anomalies can occur, fundamentals can shift, so be cautious. I expect some significant volatility ahead.
In case you haven’t noticed, I post various charts in the Substack notes every week. You can find them all here. (click on the link)
P.S.: Occasionally, I share new analyses exclusively for free subscribers. Subscribing gives you email updates on these posts, plus extra insights and deeper research from the time you join onward; past analyses are not included.
If you liked this post from @Fiorente2’s Blog, why not restack and share it?
© 2008–2026 Fiorente2.com. All Rights Reserved.
Disclaimer: This analysis is for informational and educational purposes only and should not be considered investment advice. Read our full disclaimer.
Disclosure: From time to time, I may hold positions in the securities mentioned.