
Stock Market Volatility Continues
#255 An update on the main trends in the US indices: Nasdaq, S&P 500, DJIA, the Taiwan Stock Exchange, and the Australian All Ordinaries Index.

Last week, I mentioned that during the 2020 crash, it took several weeks for investor confidence to grow before a bottom was established. In today’s market circumstances, it will take time for investors to regain confidence, especially considering how the tariff levies between the US and its trading partners will affect the global economy.
In the last few weeks, many world indices fell into a lower parabolic trendline and may have found support for now.
Others may not have reached a lower parabolic trendline, where they could find support, and could be vulnerable to more declines to come, as you can see in the chart below of the Taiwan Stock Exchange Weighted Index. This may be an important index to follow as the ongoing US-China trade war may influence the supply chains for the semiconductor industries worldwide.
The world-leading semiconductor manufacturer, the Taiwan Semiconductor Manufacturing Company (TSMC), is listed on this index.
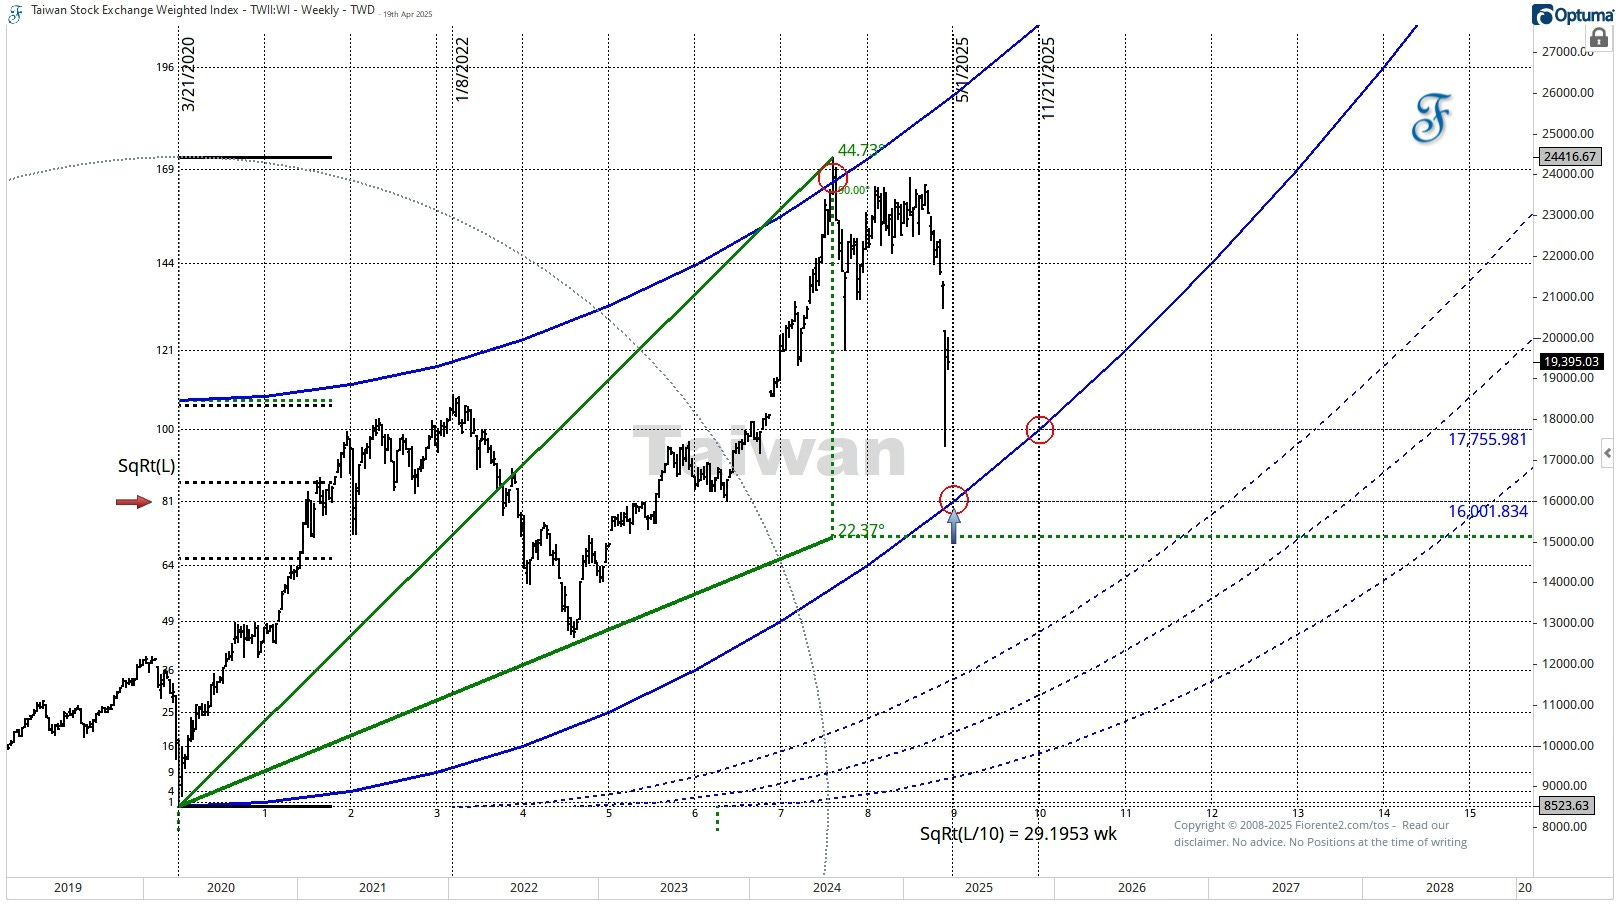
For new readers: on the parabolic trendlines, time and price are in balance, and a change in trend could occur, as seen at the high in the chart above.
Although the Taiwan Stock Exchange Weighted Index just managed to trade above its daily breakout or reversal level, it still trades below its weekly and monthly levels.
It may take some time before a low in this index is established. This could happen at the square of Nine, in the next few weeks, or at a later moment in time. See the blue and red arrows. Trading below the lower parabolic trendline (solid blue) could trigger a sell-off to this index's lower trendlines (dashed blue lines).
In the last few days, only a few other world indices, like the Australian All Ordinaries, the Korean Kospi Index, and the Indian Nifty50 indices, managed to trade above their daily breakout or reversal levels. Often, the Western indices follow the trend from the East. This may be an early sign of some recovery, but I like to see higher highs and higher lows established first.
In this post, I will show premium subscribers the long-term trend in the Australian All Ordinaries, update them on the breakout or reversal levels of the main World Indices, and provide a weekly update on the US Indices.