Introduction
Last week, I discussed a W.D. Gann method for squaring out Price and Time, or how to forecast a possible change in trend. I used a graph of the NYSE to emphasize that the stock market may not have reached its peak yet. In the same article, I also pointed out that the low of early August was the anticipated 20-year low, accurately aligning with the exact day 20 years prior. This low represented 1/3 of a 60-year low, and a low in the 60-year cycle was expected around the same time. From this, it is evident that we may not have seen the high in this bull cycle yet. Additionally, even a stock like NVDA hit a low at the same time 20 years ago.
A few days later, I demonstrated another practical application of the W.D. Gann method on Twitter. This time, I showed how to square Price and Time, a technique W.D. Gann used to use. As per his advice, one should square the high, the low, or the range to anticipate a change in trend. These techniques help forecast a possible trend change, in Price and Time.
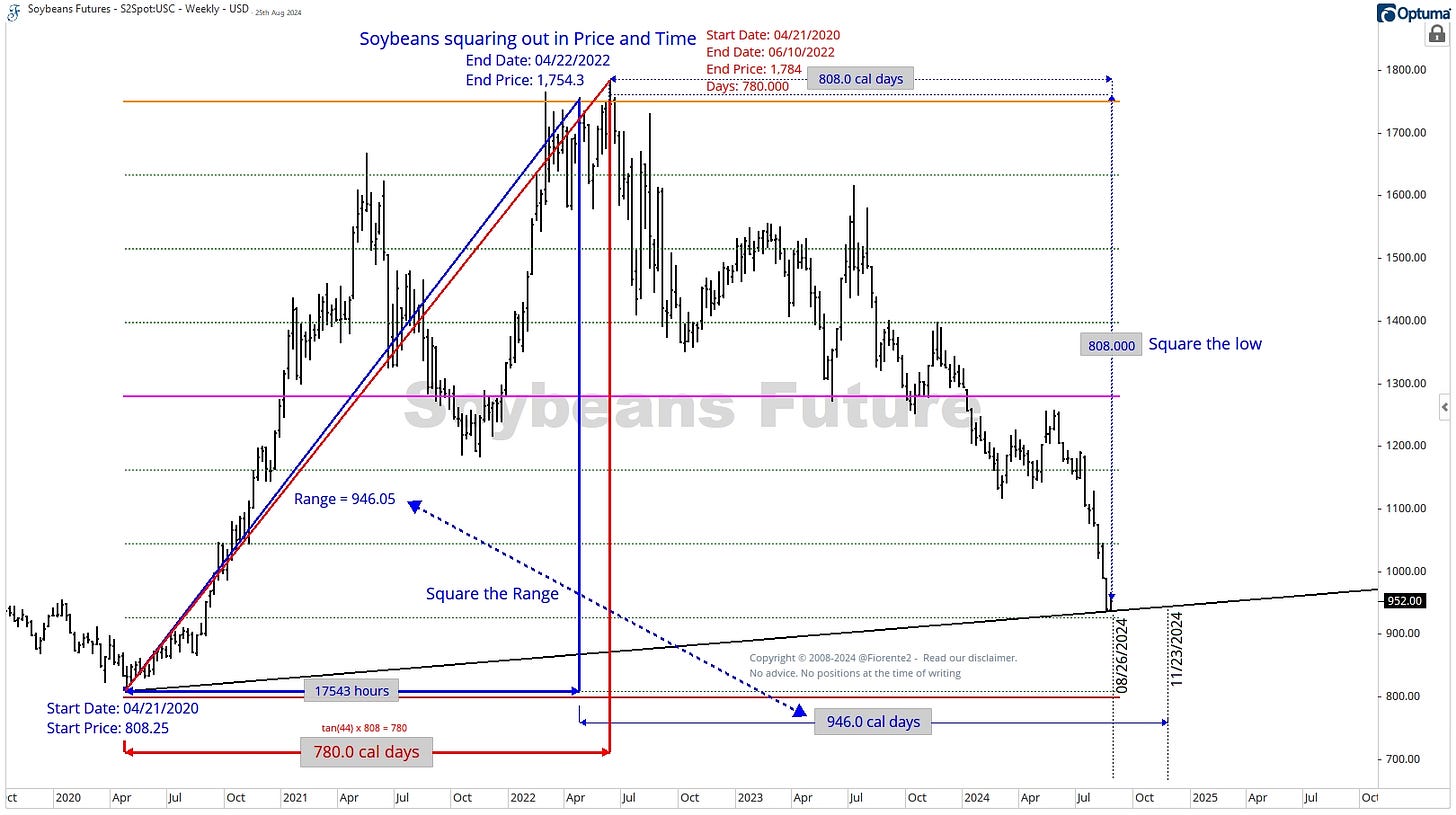
In the example below, I demonstrated in a tweet how this recently happened with Soybeans.
Eight times 360 degrees on the Square of Nine from the low at 808.25 in 2020 forecasted the price-high. As Gann stated: “The squaring of Price with Time means an equal number of points up or down balancing an equal number of time periods—either days, weeks, or months.”
So, the calculation is the Squareroot of 808.25 + 2 (for 360 degrees) and re-square the outcome, which is (SQRT(808.25)+2)^2 =925.76. So, the interval is 117.72 to reach the first 360 degrees or the first increment. 8 cycles later, the high is at 1750.
How to calculate then in Time when a crest is due form a significant low? On the April 2020 low, knowing a possible square out on a price level of 1750, which is at the 8th level of 360-degree moves in price on the square of nine from the low, one could look for a high in 1750 hours or days from that 2020 low, or a harmonic of this number like 175 days or 17500 hours. 17500 hours or 729 days from the April 2020 low is April 20th, 2022. This is only 2 days from the second top on April 22nd, 2022.
The market squared out three times in 2022: in February, April, and June. The second top on April 22nd squared out in Price and time(17543 hours). If you shift the decimal point in hours between the low of April 2022 and the high of April 2022, you will get to the exact midpoint of 1754.30, which was the price of April 22nd, 2022.
One could also calculate this using simple trigonometry. As time and price balance on a 1x1, one could take the tan(45), which =1, and multiply it by the price. Hence, perhaps in 808 days, weeks, hours, or equivalent harmonics.
Tan (45) equals 1. When the angle is 45 degrees, the tangent value of 1 corresponds to a slope of 1, indicating that the line rises by 1 unit for every 1 unit of horizontal distance. A perfect square.
But markets are not always perfect, so any degree can be used. Tan(44) is nearly perfect. Taking the tan(44) degrees and multiplying it by the price of the low at 808 will give you 780 calendar days, which was reached on June 10th, the third top in a row.
When a high has been confirmed one could calculate when a low in time may be reached.
As Gann stated: “The squaring of Price with Time means an equal number of points up or down balancing an equal number of time periods—either days, weeks, or months.”
Yesterday, exactly 808 days later from the crest, we saw a low in both Price and Time again, which was close to the 7/8 point from the high. Remember what Gann taught: "It is important to watch the 7/8 point of the move."
You could also square the range in Time from the crest, which may cause a secondary low or even a lower low in November 2024.
Recently Soybeans have stabilized at a precise price point since April 2020, following a Square of Nine calculation, as shown by the black line. I expect some upcoming volatility and foresee a similar fractal pattern emerging, akin to the one before the 2020 low.
This is an example of a technique that W.D. Gann used to forecast when price and time are in balance and a change in trend may occur. In his Stock Market Course, W.D. Gann introduced another method for forecasting price and time. I have used this alternative approach for my forecasts for NVDA and TSLA. Premium subscribers can access updated forecasts, including updates for the US Indices following the Gann Master Cycles and an update on the NYSE Transit To Natal, in the post below.


