
Squaring out in price and time
Did $SPX squared out in time and price on Sept 30th 2022?

Introduction
In his stock market course W.D. Gann explained the correction or reactions of the stock market when price and time are equalled. He mentioned:
“This is one of the most important and valuable discoveries that I have ever made, and if you stick strictly to the rule, and always watch a stock when Price is squared by Time, or when Time and Price come together, you will be able to forecast the important change in trend with greater accuracy.” W.D. Gann Stock Market Course
and: “The squaring of Price and Time means an equal number of points up or down balancing an equal number of time periods - either days, weeks or months.” W.D. Gann Stock Market Course
Note: You can also use the number of hours as that is a time period as well, and any other time period may work.
Later on in this course he explained that: “Market correction or reactions are simply the squaring out of minor time periods and later the big declines or big advances are the squaring out of major time periods.”
Last Friday, September 30th 2022, the SPX squared out in Price and Time, not by days but by trading hours as you can see in below chart.
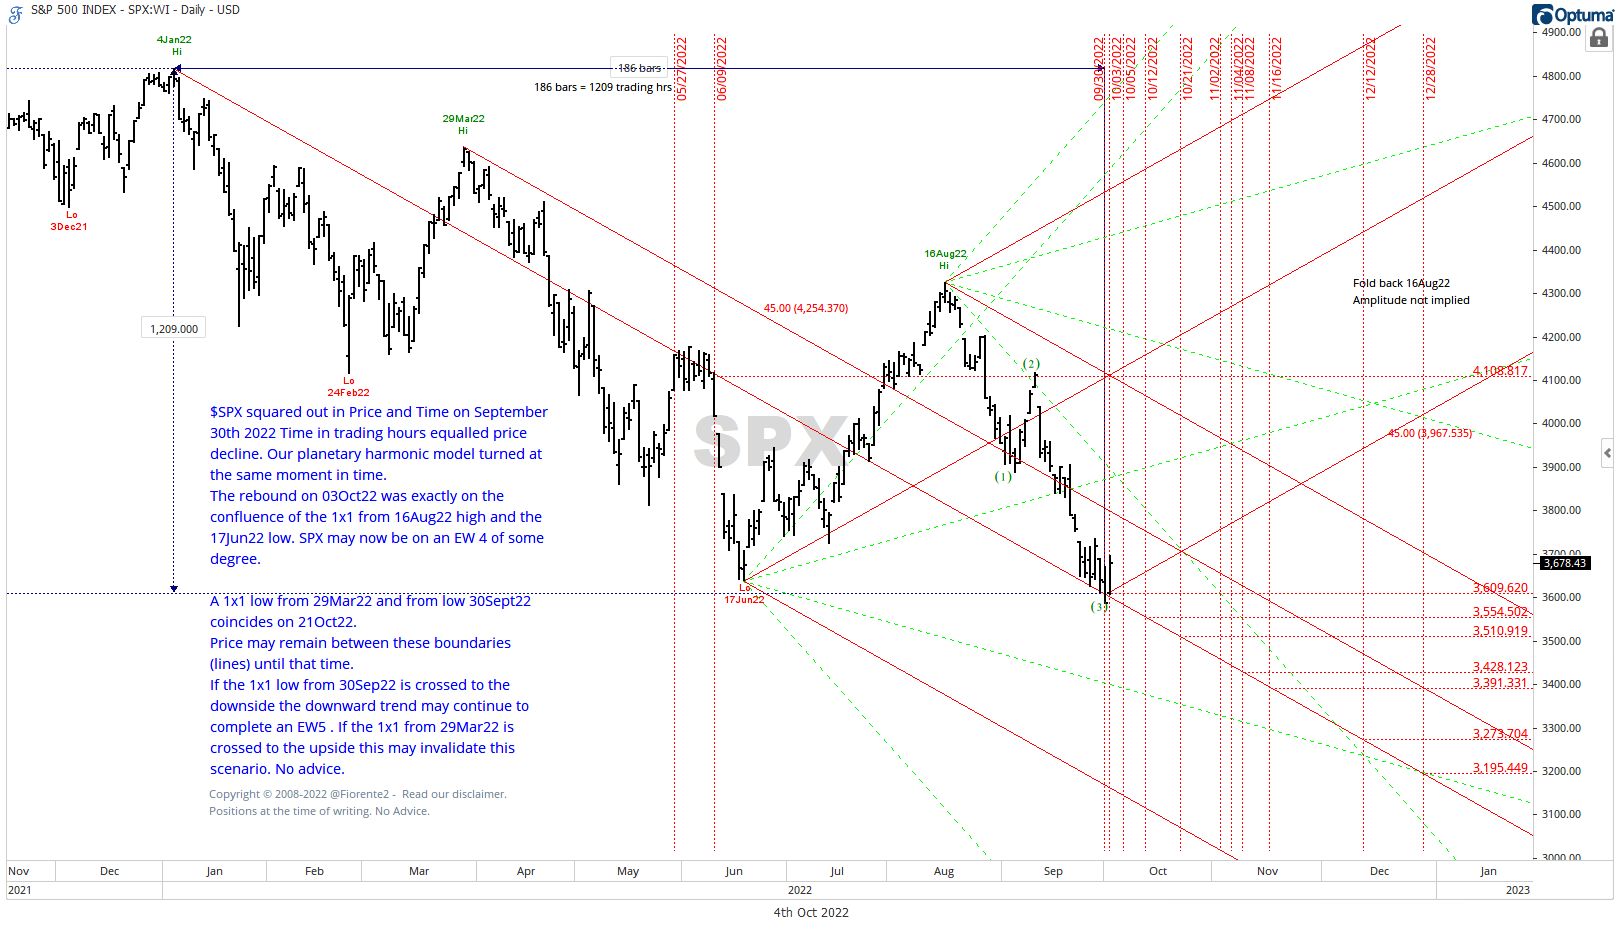
For the SPX are 6.5 hours in a normal trading day and in 1209 hours the SPX squared out in Price , $1209 lower than the high of on January 4th 2022. The SPX fell on the 1x1 timing line that follows a $6.5 decline per trading day.
This is interesting as our planetary harmonic model also had a low on October 1st 2022, just one day later. Read our latest update on the planetary harmonic model we are following here.
The current rebound may only be a smaller correction or market reaction as explained by W.D. Gann as a major time period may not have squared out yet. The previous Gann Master Cycle did not make a low until later this month. Our premium readers get a weekly update on this major time cycle, you can read it here.
Our premium readers can read further on this analysis in below update and review an additional bonus analysis on the SPX apart from our weekly updates. I also will explain how to maintain a price time ratio analysis or use an Andrews Pitchfork instead if you cannot draw timing lines.
Disclosure: Positions in the SPX
This analysis is intended for general informational & educational purposes only. Hypothetical or simulated performance based on past cycles have many limitations. Cycles can contract, extend and invert. Hence, past performance is no guarantee for the future. No advice. Read our full disclaimer.
Follow us on Twitter, and if you like this post retweet our latest update on Twitter.