
Severe Declines in World Indices
#252 A Parabolic Analysis of US Indices: Nasdaq, S&P 500, and DJIA.

Globally, major indices reacted to the US tariff announcements aimed at nearly all US trading partners. As investors feared an almost inevitable recession, the markets responded by erasing trillions of dollars in market value. Have we seen the worst, or is there more downturn ahead?
Stocks, indices, commodities, and currencies often exhibit exponential movements. The higher the price, the faster the move in time. Sometimes, this causes a parabolic move. This works similarly to the downside, often in a mirror image fashion.
Here is an example for the Nikkei 225 Index in Japan.
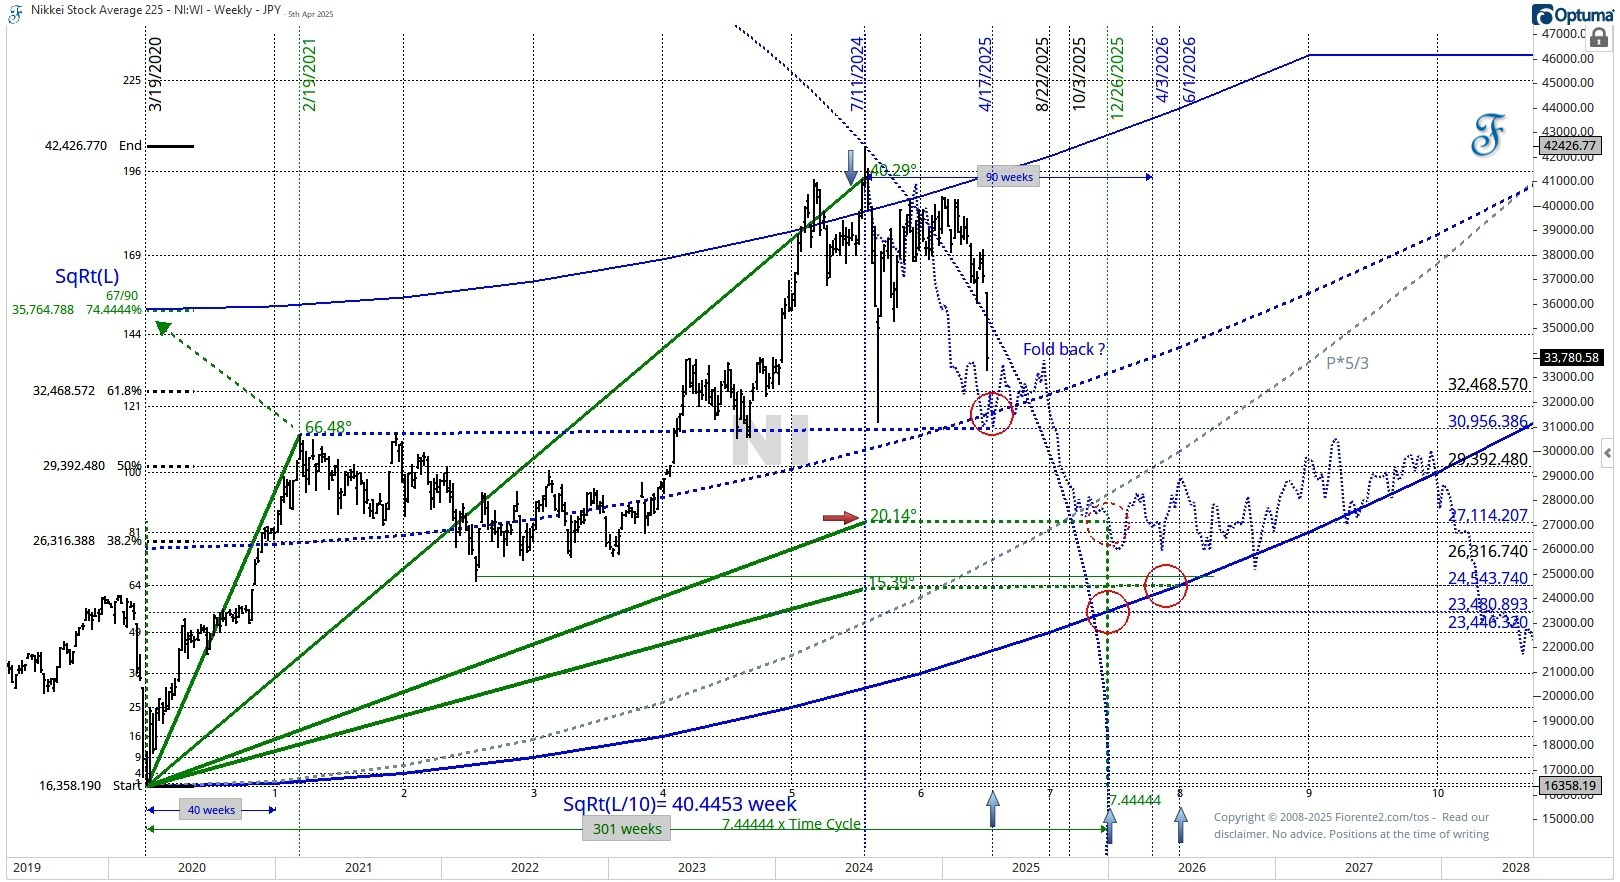
As shown in the chart above for the S&P 500, a relationship exists between time and price that explains the parabolic move, which began at the March 2020 low and ended on July 11, 2024, at the high. The lower parabolic line was plotted based on the square root of the low in March 2022, as explained on the x-axis and y-axis. The Square Root(SqRt) of the low divided by 10 gives a time cycle in weeks, as this is a weekly chart.
I have raised the lower parabolic line calculated from below proportionally to the high (based on the angle), which squares the peak at the top. This proportion not only explains the upper parabolic line but also indicates when the cycle (circle from bottom to top) will end at 1/10th of this value, in 301 weeks, or 7.44444 times the length of the time cycle.
Hopefully, we may see the decline in world indices end within the next 14 days, leading up to Easter. Perhaps the U.S. President will decide before Easter that a 10% tariff will be less harmful to the US and the rest of the world than double or triple that amount for some U.S. trading partners. This could bring the Nikkei 225 back to a mid-channel parabolic trendline. A fold-back scenario, which mirrors the uptrend toward the high in July 2025, may find support at this trendline by April 17, 2025.
The foldback may continue hereafter, and if it does from August 2025 onward, it looks like the major cycle correction may not end before the end of October 2025 or could even continue into the end of 2025.
On the US Indices, it looks like the current market has a high correlation with the 99-year cycle. I found this journal reference that explains what happened during the first months of 1926:
At the close of 1925, activity throughout all lines of business was at a high level, and during the first two months of 1926, the total volume of production and trade was generally higher than in the corresponding months of last year. Several factors, however, developed early in 1926 that caused some doubts as to the outlook for business during the remaining months of 1926, Sharp declines in the stock market, beginning about the middle of February and continuing with few interruptions until the end of March carried many stocks down and canceled most of the gains that had been made in the market as a whole since August and September.
As mentioned in my March 16, 2025, update, a similar statement can be made about the 60-year cycle, using an offset to account for the possibility that the cycle high might have occurred a few months earlier. The similarities with raising tariffs 60 years ago are striking:
Over the last few weeks, the US indices have tumbled amid inflation fears, reminiscent of May 1965—60 years ago—when President Johnson imposed a 25% tariff on light trucks in response to a European tax on chicken imports. Striking similarities. The 60-year cycle strikes again, a bit earlier than expected.
Additionally, the above major cycles have coincided with the 20-year and 40-month business cycles. In the past, this 40-month cycle has ranged from as short as 40 months to as long as 48 months; however, currently, the 40-month cycle has the closest correlation.
We will see in the following charts how the 99-year cycle, the 60-year cycle offset, the 20-year cycle, and the 40-month business cycle may explain most of the recent market move. In addition to this post, I have made news charts for the US Indices using parabolic trend lines on the daily charts to see how the current decline may unfold further