

Introduction
I have been closely following the Gann Master Cycle from 2008 onwards. At times the cycle has a high correlation, as in the last four years, and at times the cycle inverts for some time probably due to some other cycles and seems less accurate. This year the Gann Master Cycle high also seems to align with Venus going retrograde (Rx) on December 19th 2021. Since 2000 there have been 2 instances on Venus Rx which both caused a change in trend on the lows in 2002 and 2009.
Last year I looked into these dates and reviewed the lows of the S&P 500 at October 10th 2002 and March 6th 2009. It appeared to me that not only Venus started on a retrograde(Rx) movement and causing a change in trend (CIT) but also time(longitude) and price of certain planets were aligned on these dates. We know from W.D. Gann that a change in trend will occur when price is squared by time, or when price and time come together.
Will this happen again on Venus Rx this year? Let’s review what happened so far and what could lay ahead of us in the near future based on past cycle behaviour.
The October 2002 low
On October 10th 2002 the S&P500 closed on 803.92. Venus is going Rx. Saturn Helio on the same day was on 83.3° longitude and when converting degrees to price this equals 803.3 (83.3+360+360). A change of trend occurred not only because of Venus Rx but also time(longitude) and price aligned on this date.
As Gann mentioned in his commodity course (1954):
“This is one of the most important and valuable discoveries I have ever made, and if you stick strictly to the rule and always watch an option when Price is Squared by Time or when Time and Price come together, you will be able to forecast the important changes in trend with greater accuracy.” … and he also mentioned: “..we use the circle of 360 degrees to measure time and price”.
The March 2009 low
The low on the S&P 500 on March 6th 2009 hit 666.79. Next to Venus Rx, Mars Helio on this day was on 306.93°, Jupiter Helio on 307.90° , corresponding respectively to price levels of 667 and 668. The close on the same day was on 683.38 which aligned with Mars on 322.85° and the corresponding price level of 683 (322.85+360). Again time and price aligned.
Timing the expected December 2021 high
Will Venus Rx on December 19th cause a change in trend again and what level could be reached by that time converting longitude (time) to price?
Venus and Mars were both active on the 2002 and 2009 lows. From 2002 low the Venus Mars Helio cycle turns exactly to the same spot in the zodiac after 21 cycles (21x360°=7660°) on December 13th 2021. From 2009 low to December 19th 2021 is exactly 14 cycles (or 5040°) of Venus Mars Helio cycle.
The Venus Mars Geo cycle is also interesting. This cycles returns to the same degree measured from October 2009 low (6x360°=2160°) on December 19th , and on December 23rd 2021 measured from March 2002 low (9x360°=3240°).
So, if history repeats I am expecting a high and a probable change in trend somewhere between December 13th and December 23rd 2021. The mid point point is December 18/19th at Venus Rx.
Squaring time with price
As the difference between 2002 and 2009 price levels is 223° in price I am looking for a price that equals this degree. A price level a 4903 is on the 223°angle. In below chart you also see that planetary positions correspond closely to this price level. Mars Helio at 226.37° corresponds to 4906. and Mars Geo at 239.71° corresponds to a price level of 4920. Also the sun is at 261.18° which is a Fibonacci number.
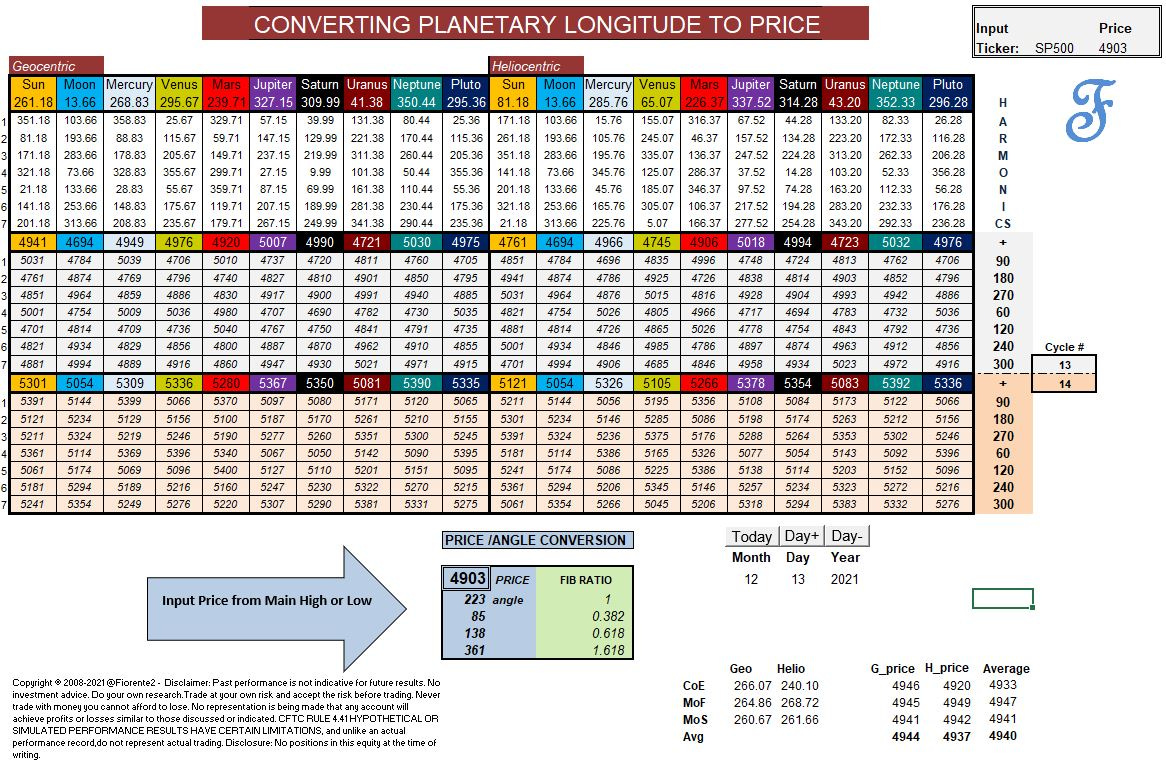
W.D. Gann also taught us that the 225° angle, which corresponds to a price level of 4905 is important to watch for a change in trend. Note that Mars Helio on this date is on the 225° (4905) as well.
A few days earlier on December 11th Venus and Pluto will go conjunct, start on a new cycle as well. Venus and Pluto share the principles of money and values and Pluto is also associated with threats and danger. This could lead to the realisation about the safety and security of the stock market and that traders realise the stock market has gone to high.
An alternative price level could be 5040. As from 2009 low the Venus Mars Helio cycle travelled 5040°, converted to price 5040 ( 1°/$) this corresponds closely to the price level of Neptune both in Geo (5030) and Helio (5032). An open or high on 5040 and low/close on 5030/5032 could well be possible.
Note: we could also find price resistance on the next higher cycle (e.g. up to 5400 (15x360°) if the stock markets gets really extended as indicated in above chart.
Gann Master Cycle projection
The Gann Master Cycle high for the S&P500 is expected at December 12/13th 2021 in time. In below chart I plotted the Gann Master Cycle (teal) and the expected corresponding price levels (4920/5040) based on some of the planetary positions from above analysis. In the cycle pane you can see the Venus H (red) /Mars H (green) cycles, next to the approximate 9 year Juglar cycle (blue) coming into the same time zone.
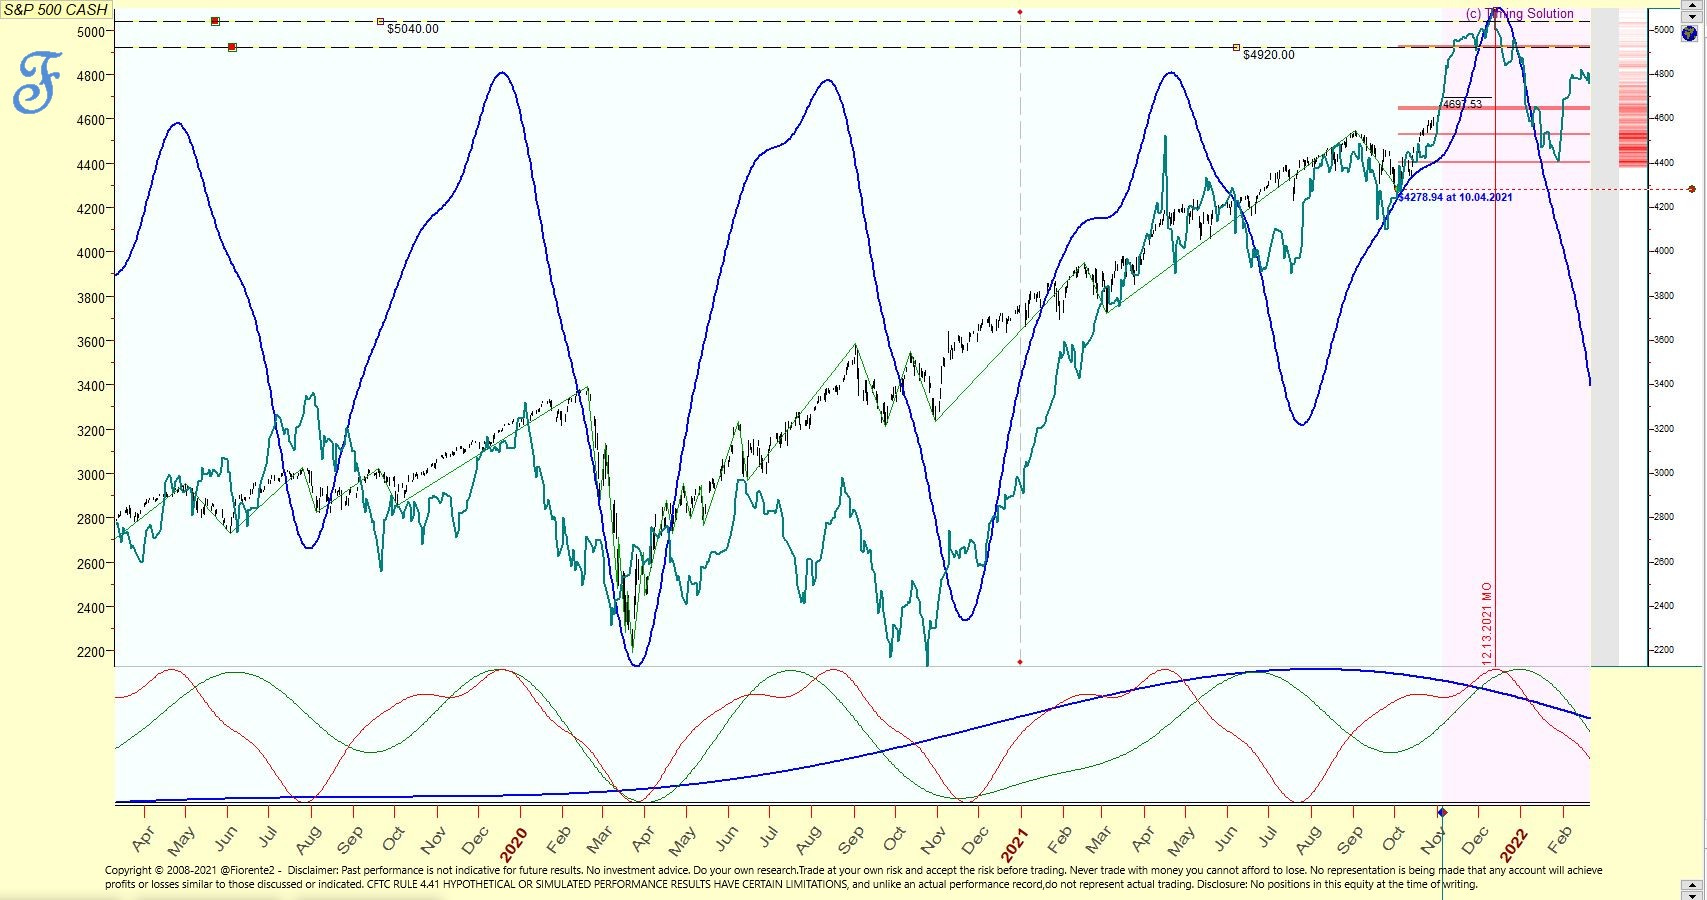
A Fibonacci resistance derived from previous highs and lows is plotted at around 4926. This all seems to underpin a possible high around mid December 2021.
Conclusion
The analysis of squaring time and price based on past cycle actions and future projections of the cycles mentioned in this analysis could give us a hint for a possible high and change in trend around mid December 2021 for the stock market.
Whether or not the projected price levels will be reached is to be seen. As always we do not trade the forecast but the chart in front of us. It could take some time, even into early 2022, before the cycles turn down.
Disclosure: No positions in this index at the time of writing. Read our full disclaimer.
PS: I am preparing a special publication: The Fiorente2 - Yearly Stock Market Outlook 2022. Stay tuned for further notices and let me know if you are interested in reply to this post and what you like to be included in this 2022 Stock Market Outlook.
I have decided that the first 333 subscribers to this exclusive publication will get a 66.66% discount on the regular price. The next 333 subscribers will get a 33.33% discount, and you can guess all of the next 333 subscribers and beyond will pay the regular price ($99). Stay tuned and let me know if you are interested in reply to this post.
Very interested 2022 Stock Market Outlook
Hi Fiorente, do the chart come from timingsolution.com? I have been using sentinenttrader as a timing tool, but it's a hit and miss?