
Riding the Waves of Economic Uncertainty
#263 An update on TSLA and the main trends in the US Indices

Introduction
The uncertainty surrounding US economic policies is expected to persist for some time. Last week, the US government paused the levies on most European products; however, just a week later, it imposed a steel levy, which will adversely affect both UK and European steel companies. Although the main US levies are currently on hold due to court actions, it is anticipated that the US government might move to impose specific tariffs for different industries.
This uncertainty regarding how these US levies will impact the global and US economy continues to put investors at a disadvantage at times. Despite the challenges investors face, stocks and indices remain on their dominant cycles. Analyzing both longer and shorter-term cycles may provide some reassurance. The dominant cycle theory, proposed by Jim Hurst, may help in identifying the position within these longer or shorter cycles.
Let’s take TSLA as an example, as we are approaching a seasonal period in which TSLA often makes a surge. (IPO: June 29, 2010)
In the below chart, you can see the dominant cycles for TSLA at play.
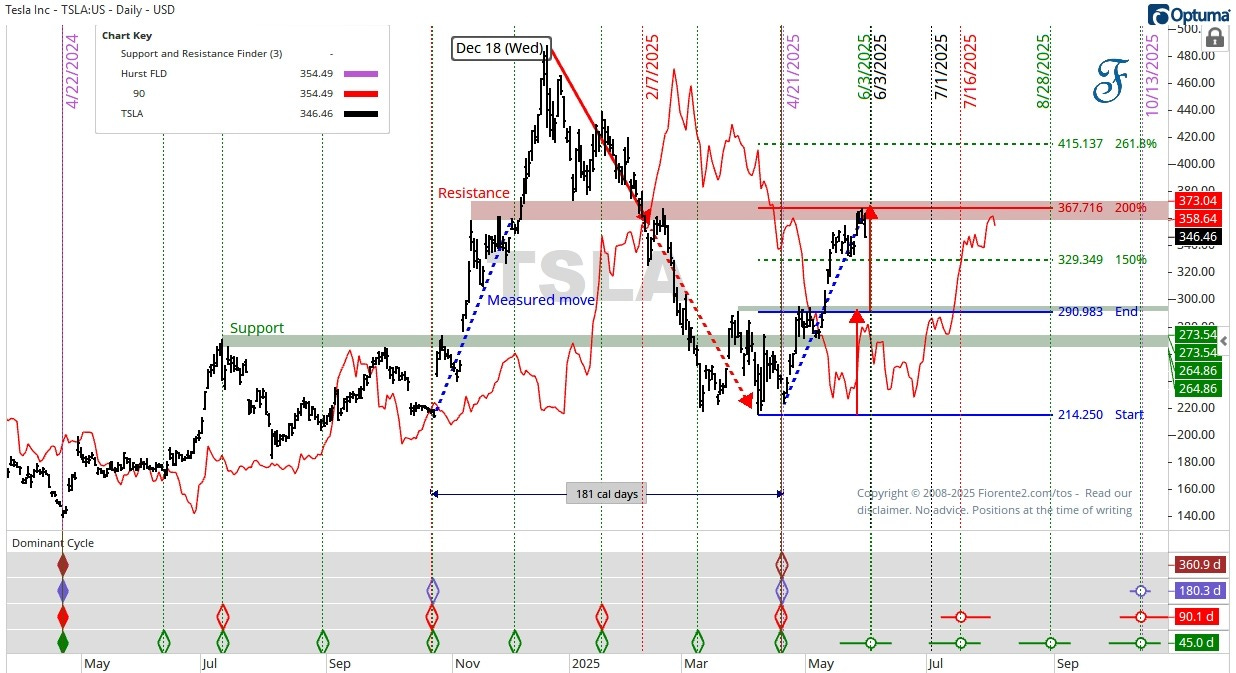
The 90-day dominant cycle (red) has been displaced as an overlay, half the span (45 days forward. This pattern is called an FLD (Future Line of Demarcation in Hurst’s methodology. On February 7th, 2025, the price crossed this pattern, confirming the crest of December 18th. The move from the crest to this point can be projected forward as a potential price target. As you can see, this has nailed the low of April 21st, 2025, in Price and Time, synchronizing across multiple cycles (45, 90, 180, and 360 calendar days). Note the diamonds stacked on top of each other.
Going forward from the low of April 2025, TSLA has crossed the 80-day FLD (red) again. Recently, TSLA also hit the expected price target and old resistance. This is close to a 45-day cycle crest (green). This 45-day cycle has not yet been confirmed; note the circles and whiskers, which indicate potential inflection points where changes are expected to occur.
The Hurst methodology is quite effective in deciphering both longer- and shorter-term cycles. In today’s post, I will present both a longer-term and a shorter-term view of the SPX to reveal the most dominant cycles currently at work.
Premium subscribers can continue reading from this point. Consider becoming a premium subscriber for no more than the cost of a good cup of coffee and supporting my work.