

Introduction
In these modern times we all know what timelines mean in our social media apps. Timelines are important in the stock market as well. Gann, Bayer, Benner, Tritch and many other old masters who made quite some studies into the importance of time in stocks and commodities trading and forecasting.
In his book “Time factors in the Stock Market” George Bayer discussed the concept of time.
“Time, as we are able to grasp it philosophically, is a line running backward to what has passed and forward to what it will be”.
Think of this, as an event which happened in the past, may have an effect in the future on the same timeline. What the impact will be is dependent on the impact of the event. Throwing a small stone in a pond may have some rippling effects; a bigger stone may have even a greater wave effect. The same happens in the Stock Market.
It is just the same as what W.D. Gann mentioned about the timeline in terms of Cause and Effect and that the future is just a repetition of the past.
“Every movement in the market is the result of a natural law and of a Cause which exists long before the Effect takes place and can be determined years in advance. The future is but a repetition of the past, as the Bible plainly states: ‘The thing that hath been, it is that which shall be; and that which is done is that which shall be done, and there is no new thing under the sun’- Eccl. 1:9” W.D. Gann Stock Market Course
In below chart you can see the forecast George Tritch made public over 100 years ago based on the work of Benner how cycles may repeat well into 2059.

The above cycle graph is taken from 1875 — "Benner’s prophecies: Future ups and downs in prices" extended probably by George Tritch into 2059. Based on a 11 year solar cycle: corn and pig prices peaks every 5 or 6 years, cotton 11 yrs. This makes it an interesting forecast based on a natural cycle(s) that may repeat again and gain.
W.D. Gann made a similar forecast based on the 18/19 year cycle. Both forecasts pretty much hint to a low in 2023.In his Stock Market Course W.D. Gann discussed the concept of forecasting by time cycles. Looking back, 60 years, 49/50, 30, 20 10, 7 or 5 years and the minor yearly cycles of 3, 2 and 1 years.
In my work I use the same concept with the 60-year Gann Master Cycle as the most important cycle for future direction and I dynamically update the forecast on a weekly basis for my premium subscribers. In his 1929 forecast W.D. Gann used the 60-year cycle as well. I wrote about this in an earlier post on Substack a year ago and how his forecasts compares to a dynamic updated forecast.
For 2022 I have used the Gann Master Gann Cycle projections for our forecasts on the DJIA and the SPX . I dynamically update and publish the projections on a weekly basis including a forecast for the Nasdaq Composite following a different Gann Master Cycle.
A few weeks ago, we took this even further using planetary data to refine the forecast. Based on past cycles I published below Planetary Harmonic Model on the SPX for 2022.
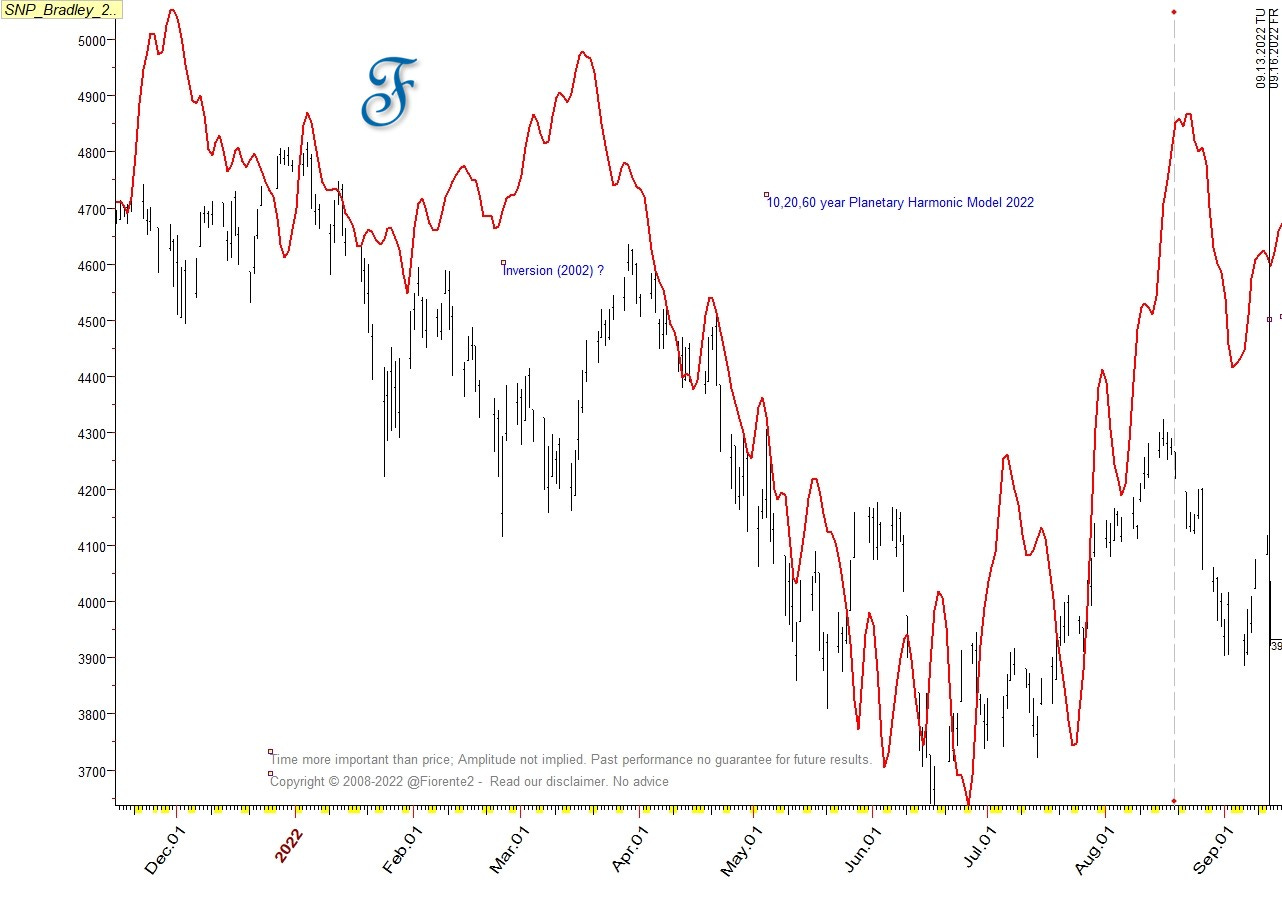
The above model follows W.D. Gann’s observation that the 10-, 20-, and 60-year cycles are quite important to look at when making an annual forecast. As you can see - apart from two inversions on the 2002 data early this year - this forecast worked very well, so far. Even the recent dive on September 13th 2022 was seen in this planetary model. Note: this model is not configured on a composite of the years mentioned, but the model actually uses the planetary data of these years as well. Hence, it is a more refined model.
Of course, cycles can contract, extend and invert as the latter shows in above chart. The amplitude in above chart is also not implied to re-occur. Time is more important than price. Volatility over time will change. The small glitch on above chart is actually bigger in reality as we know now. Bigger moves indicated in the projection may even be smaller. As always, you can not trade the projection, but a projection can help to find areas of probable changes in trend past cycles and planetary data. There is no guarantee that the past will repeat in the future again. Anomalies can occur. Always use the chart in front of you instead.
I promised our premium subscribers to publish the Planetary Harmonic Model for the DJIA and the Nasdaq as well apart from our weekly Gann Master Cycle forecasts. Our premium readers can now find the projections for the DJIA, SPX and COMPX based on this 2022 model further in this post. Projections are into the end of 2022. Going forward I will update these Planetary Harmonic Models with the latest stock market data for the DJIA, SPX and the Nasdaq Composite on a weekly basis.
Disclosure: Positions in the SPX
This analysis is intended for general informational & educational purposes only. Hypothetical or simulated performance based on past cycles have many limitations. Cycles can contract, extend and invert. Hence, past performance is no guarantee for the future. No advice. Read our full disclaimer.
Follow us on Twitter, and if you like this post retweet our latest update on Twitter.