

Introduction
NVDA has been in a range bound move defined by two Saturn lines for the last 6 months. Yesterday NVDA hit the upper Saturn timing line at $216.83 and pulled back. As of writing it’s trading at $209.57. That kind of touch-and-retreat at a 6-month ceiling is, in my experience, worth examining closely.
NVDA - The 6-month range
Since the crest in October/early November last year, NVDA has been trading within a channel defined by two Saturn timing lines. The upper Saturn line sits at $216.830.
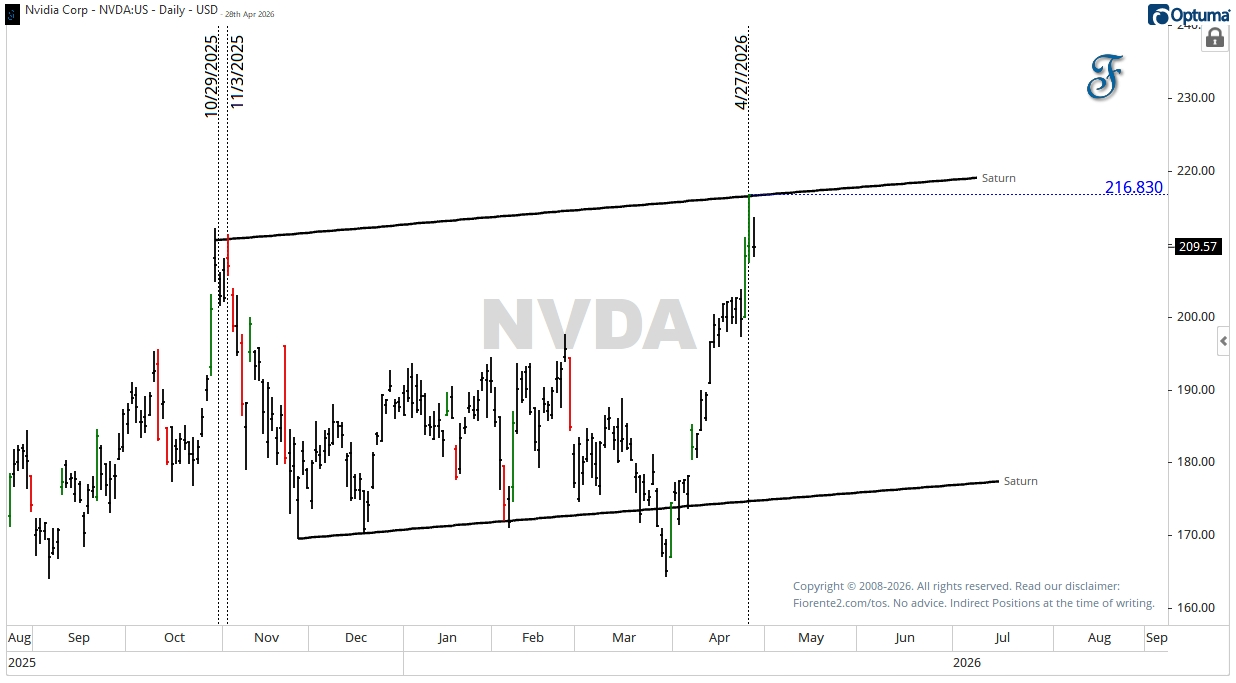
Yesterday, NVDA hit the upper Saturn line at $216.830. As of writing, the stock is trading intraday at $209.57. The importance of this timing line is that on this line price and time are in balance, which is an inflection point on which the trend can either continue, or pull back from. A break above the upper Saturn line would be a break out of the 6-month range, which I’d consider a bullish move.
NVDA - Mars through the zodiac
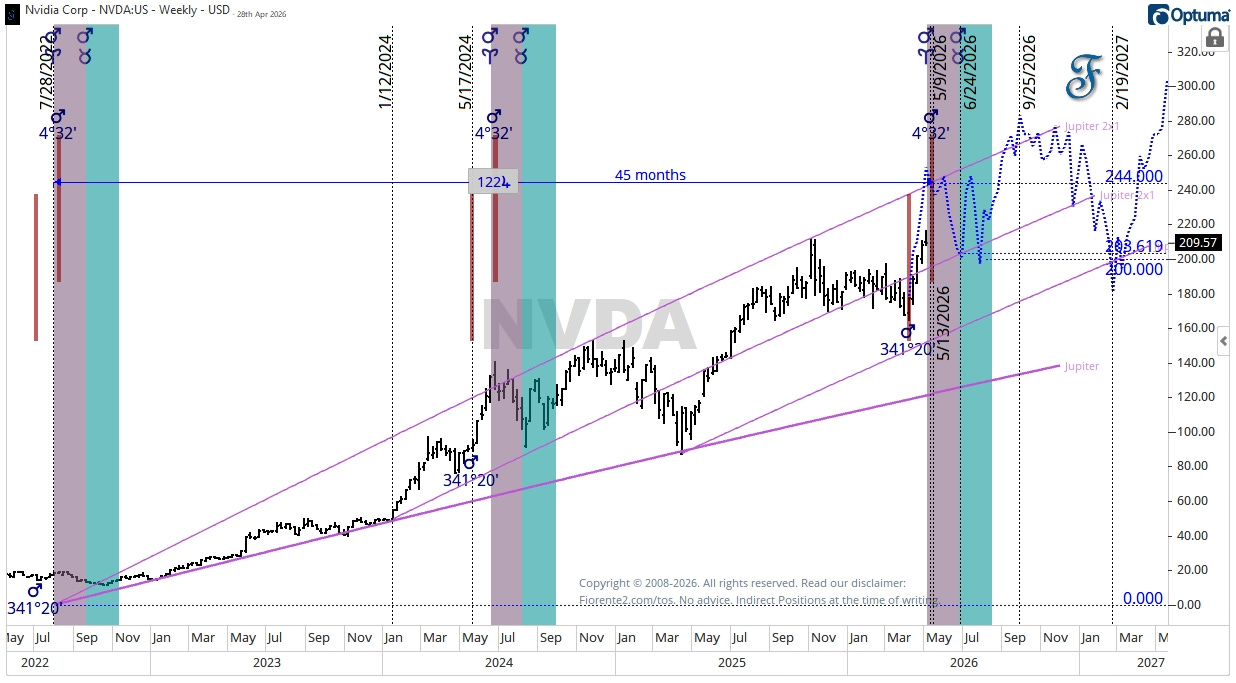
The weekly chart shows when Mars ingresses Aries and Taurus from a heliocentric perspective. Mars at 4°32’ has marked three significant turns: around the July 2022 ingress in Aries, the May 2024 high, and now April/May 2026. Based on the last two cycles, this is a key window in time for NVDA.
The default foldback, plotted in dotted blue, replicates the past cycle behavior from May 2024 up to February/March 2027, with a potential upcoming crest between May 9th and 13th and perhaps a pullback into the end of June 2026.
Hereafter, I expect NVDA to surge into a potential crest around $270-$280 in September 2026, after which a longer-term downtrend may start into February 2027, bringing the stock back towards the $200 price level, at which point Mars will change signs from Leo to Virgo.
If NVDA can break through the Saturn resistance, I can see a scenario in which NVDA might surge into a $240-$244 price level by the first or second week of May.
The 2x1 Jupiter timing line, drawn from zero price level in July 2022 when Mars enters Aries, also points toward $244.00. This represents a 45-month, or 122° move of Jupiter Helio from July 2022.
As cycles can contract or extend, I can even imagine the stock remaining around the $240 price level until the third week of May, where there is a Mars-Saturn confluence hotspot on May 22nd, 2026.
NVDA - Geometric timing and planetary lines
In the below chart I made a geometric analysis by adding a vector concentric circle drawn from the September 2025 low.
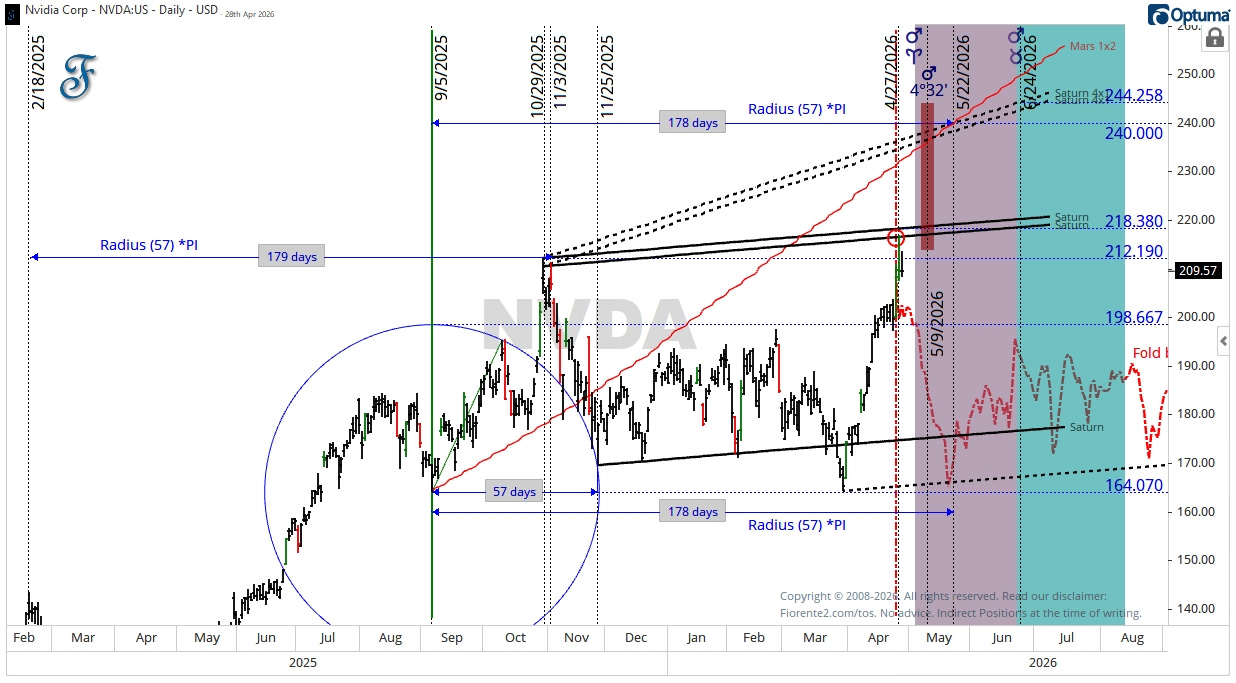
From a geometric perspective, a May 22nd inflection point aligns with the PI × radius (57 trading days) of the circle drawn on the chart. This is unfolding the cycle by half the circumference. We have seen the almost 180 trading day cycle before, between the highs of February and October 2025. Considering a bullish or bearish scenario, this can be a high or a low.
As we are very close to the moment Mars ingresses into Aries from a helio perspective, it may be possible that NVDA at this point in time will not leave the range bound move we have seen since the crest in October/early November last year.
At the time of writing today, US tech stocks, including NVDA, were under pressure. With President Trump unhappy about the Iran proposal to end the war, I can think of a scenario in which the anxiety amongst traders and investors may increase and cause the stock market to pause for some time. A foldback from yesterday’s high, plotted in red, may then be a likely scenario heading for a potential double bottom by May 22nd, 2026.
There is a potential scenario in which the cycle of Mars through the zodiac may make a low by May 22nd, 2026, instead of a high. We will then see that the almost 180-day cycle makes a February 2025 High, a September 2025 High and a May 2026 Low sequence. A High to High to Low sequence is a probable scenario that occurs many times.
Conclusion
NVDA entered a bullish phase on April 3rd based on the Mars cycle through the zodiac, and yesterday it hit the upper Saturn timing line within the 6-month sideways move. Two scenarios are now active.
The bullish case: a break above the Saturn resistance opens the door to $240-$244 by early May, and a larger crest at $270-$280 in September 2026.
The cautious case: a red foldback from yesterday’s high leads to a potential double bottom around May 22nd, the Mars-Saturn confluence hotspot.
I honestly don’t know which one plays out, so watch the chart in front of you.
This is my bias for now.
Remember, cycles can contract, extend, and invert. I may be wrong, of course. Anomalies can occur, fundamentals can shift, so be cautious.
In case you haven’t noticed, I post various charts in the Substack notes every week. You can find them all here. (click on the link)
P.S.: Occasionally, I share new analyses exclusively for free subscribers. Subscribing gives you email updates on these posts, plus extra insights and deeper research from the time you join onward; past analyses are not included.
If you liked this post from @Fiorente2’s Blog, why not restack and share it?
© 2008–2026 Fiorente2.com. All Rights Reserved.
Disclaimer: This analysis is for informational and educational purposes only and should not be considered investment advice. Read our full disclaimer.
Disclosure: From time to time, I may hold positions in the securities mentioned.