
Market Forecasting: Understanding Mass Pressure Indicators and Upcoming Cycles
#231 An update on the US Indices: Nasdaq, S&P500 and DJIA.

In 2024, I published a Mass Pressure Indicator that forecasted inflection points following the most significant planetary cycles in various global indices for the 2024 Fiorente2 Stock Market Outlook. Around the lunar and solar eclipses of March 2024, it became clear that the US Indices may have inverted.
However, the Mass Pressure indicator (blue-dashed line) did not do a bad job, as almost every inflection point clearly showed the inflection points in time. Once inverted, you can see and even calculate the high level of coincidence (83%) with the market, in this case, the DJIA, in the chart below.
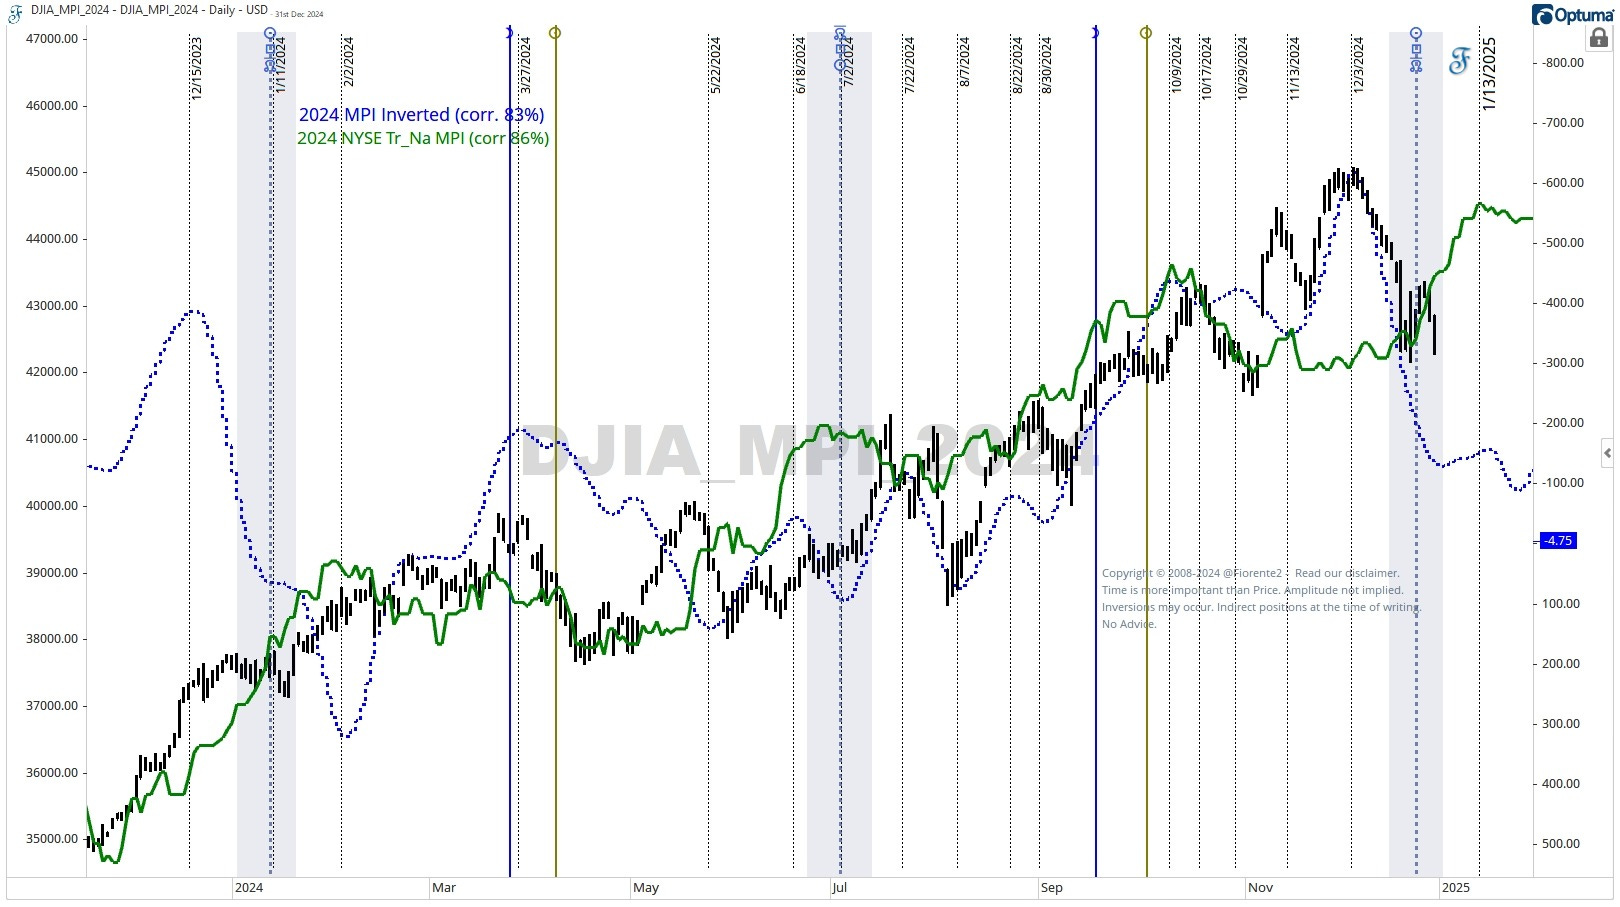
Note that the indicators shown on the above chart are overlaid on the chart but do not forecast prices. They are aligned with the price chart to show the inflection points against it.
After further examination, I developed a second indicator based on transit-to-natal analysis utilizing the first trade date of US indices in 1792. I have followed this indicator (green) on the substack since August 2024. This indicator has shown an 86% correlation until now.
It may be too soon to say if the indicator or the market has inverted, but it may have happened since early December 2024.
We do not know why markets sometimes invert and show the opposite results of past cycles. Human response to planetary cycles can differ from time to time, and circumstances from the past may not happen again in the future.
One must be alert to this; inversions can happen occasionally. So, with any mass pressure indicator, do not ‘blindly’ follow the slope; look at the inflection points. Even if the market is inverted, the inversion points may still apply. Time is more important than Price. Remember this if you take a look at Mass Pressure Indicators, including, for example, the well known Bradley Indicator
Where do we currently stand with the US indices? The DJIA's movements since the high on December 3rd have been rapid. Am I becoming bearish? Not yet, but if you observe the chart below, I have concerns about the pattern that seems to be developing.
We might be seeing the emergence of a head-and-shoulders pattern. This may be aligned with the blue dotted (inverted) Mass Pressure Indicator.
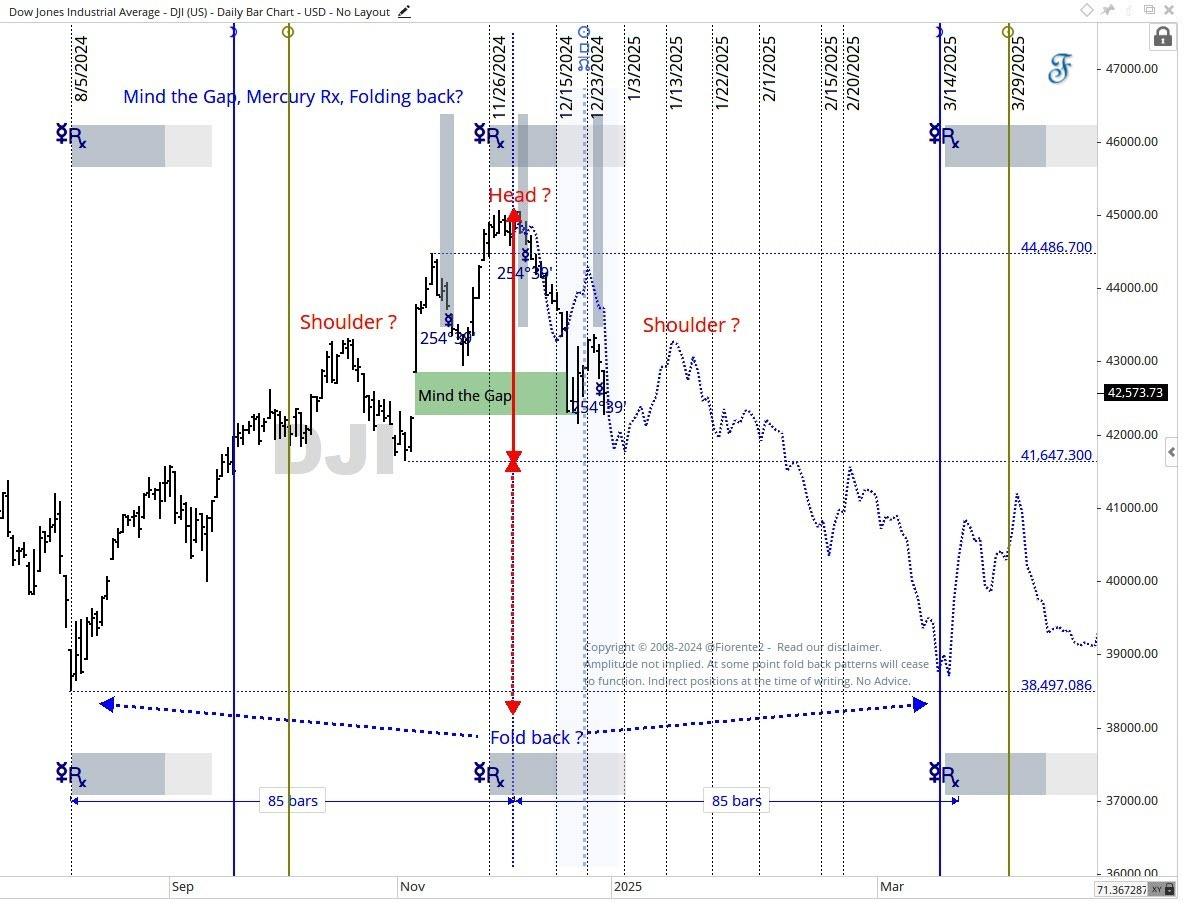
It might be possible the DJIA is folding back on the two recent periods of Mercury Retrograde (Rx). At the start of Mercury Rx the DJIA made a turn, and again on December 3rd, just a week after the start of Mercury Rx. The next Mercury Rx, is expected around the lunar and solar eclipses of March 2025. The foldback scenario shows a possible path, plotted from the December 3rd high.
So, I am watching whether the fold-back scenario will continue going into early 2025 and which Mass Pressure Indicator (green/blue) will become more dominant. At some point, fold-back scenarios will stop functioning, so we will need to observe what happens in the coming days.
Last week, I informed my premium subscribers that this would be the year’s final post. However, given the market developments, I wanted to take a moment to share one last update with you all.
In this post, I have updated the charts of the US indices, focusing on the 10-, 20-, and 60-year cycles. Additionally, I am presenting the inverted NYSE natal chart on an hourly chart for the upcoming two weeks. What does this indicate for the path forward?