
Looking Down From 45,000 Feet
#253 An update on US Indices: Nasdaq, S&P 500, and DJIA.

Last week, I mentioned that the U.S. President might conclude before Easter that a 10% tariff would be less detrimental to the U.S. and its trading partners than doubling or tripling that rate. In my opinion, there was no option for the U.S. President other than to push the pause button, and he did. The market reacted with relief. This could provide some respite for 90 days, but investors will likely remain cautious during this time, as the trade war with China continues to linger.
Much of the downturn in recent weeks resembles the COVID crash of 2020. Did we experience a near-death moment again, not for our health this time, but out of fear of financial ruin? This emotion may have led many to rush for the exits.
As expected, many world indices fell into the lower parabolic trendline I showed you last week. The Japan Nikkei 225 Index fell right into the mid-channel parabolic curve I showed you last week.
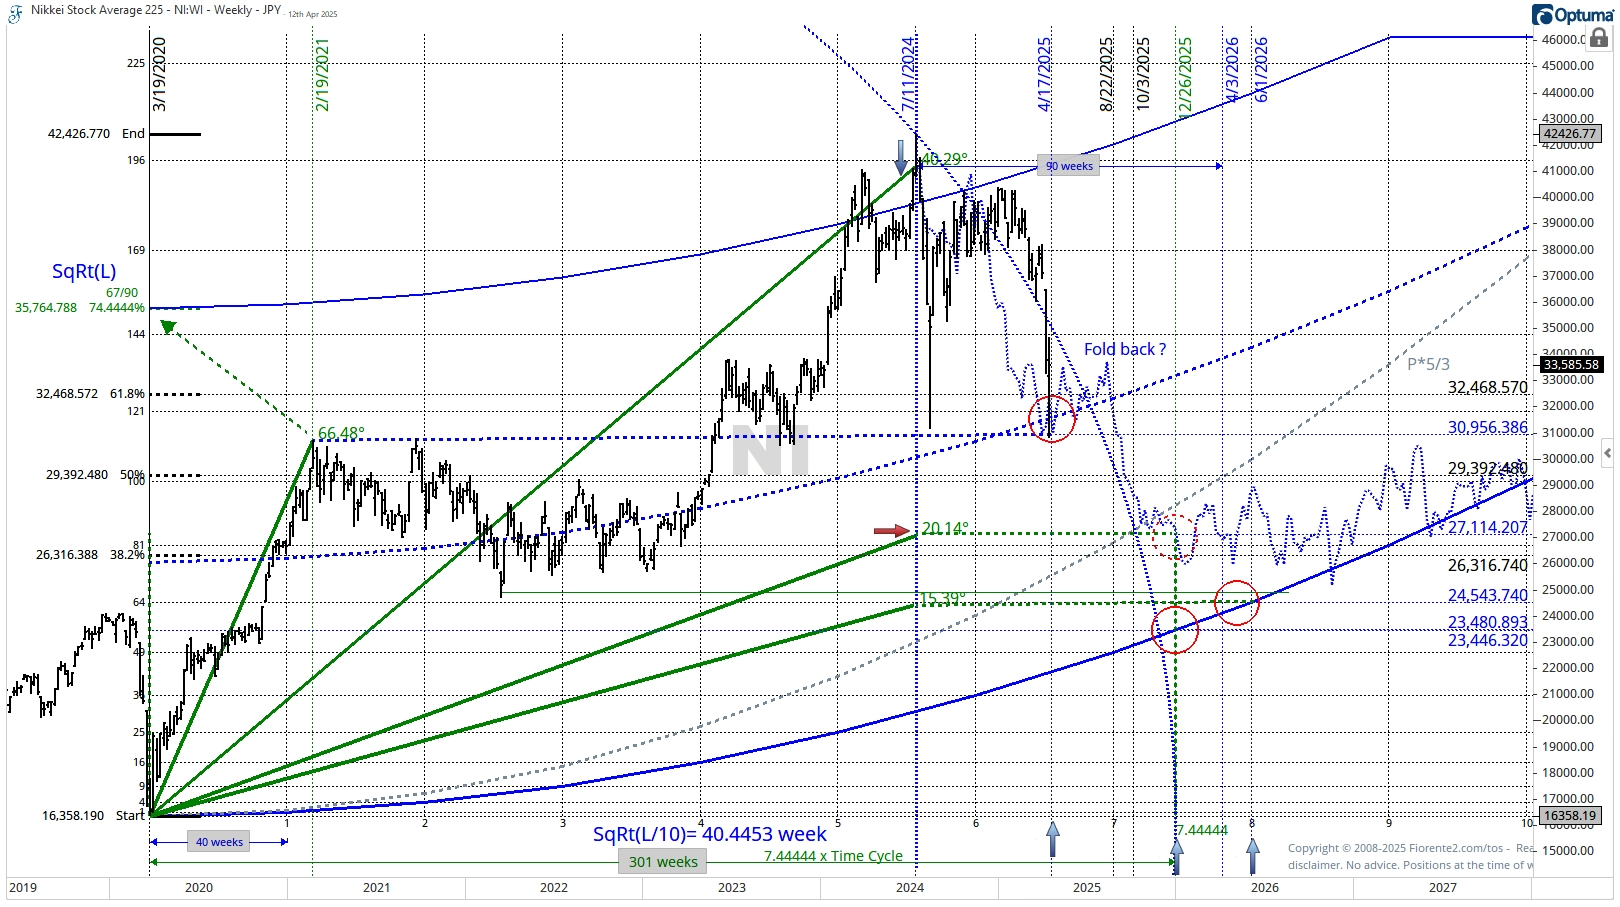
As suggested in the chart above, the cycle may not have ended yet, according to the foldback scenario (dashed blue line) and circle (grey).
Below is an example of the German DAX Index, which illustrates the value and use of parabolic trendlines. Last week, it almost matched the COVID 2020 low to nearly the exact EURO.
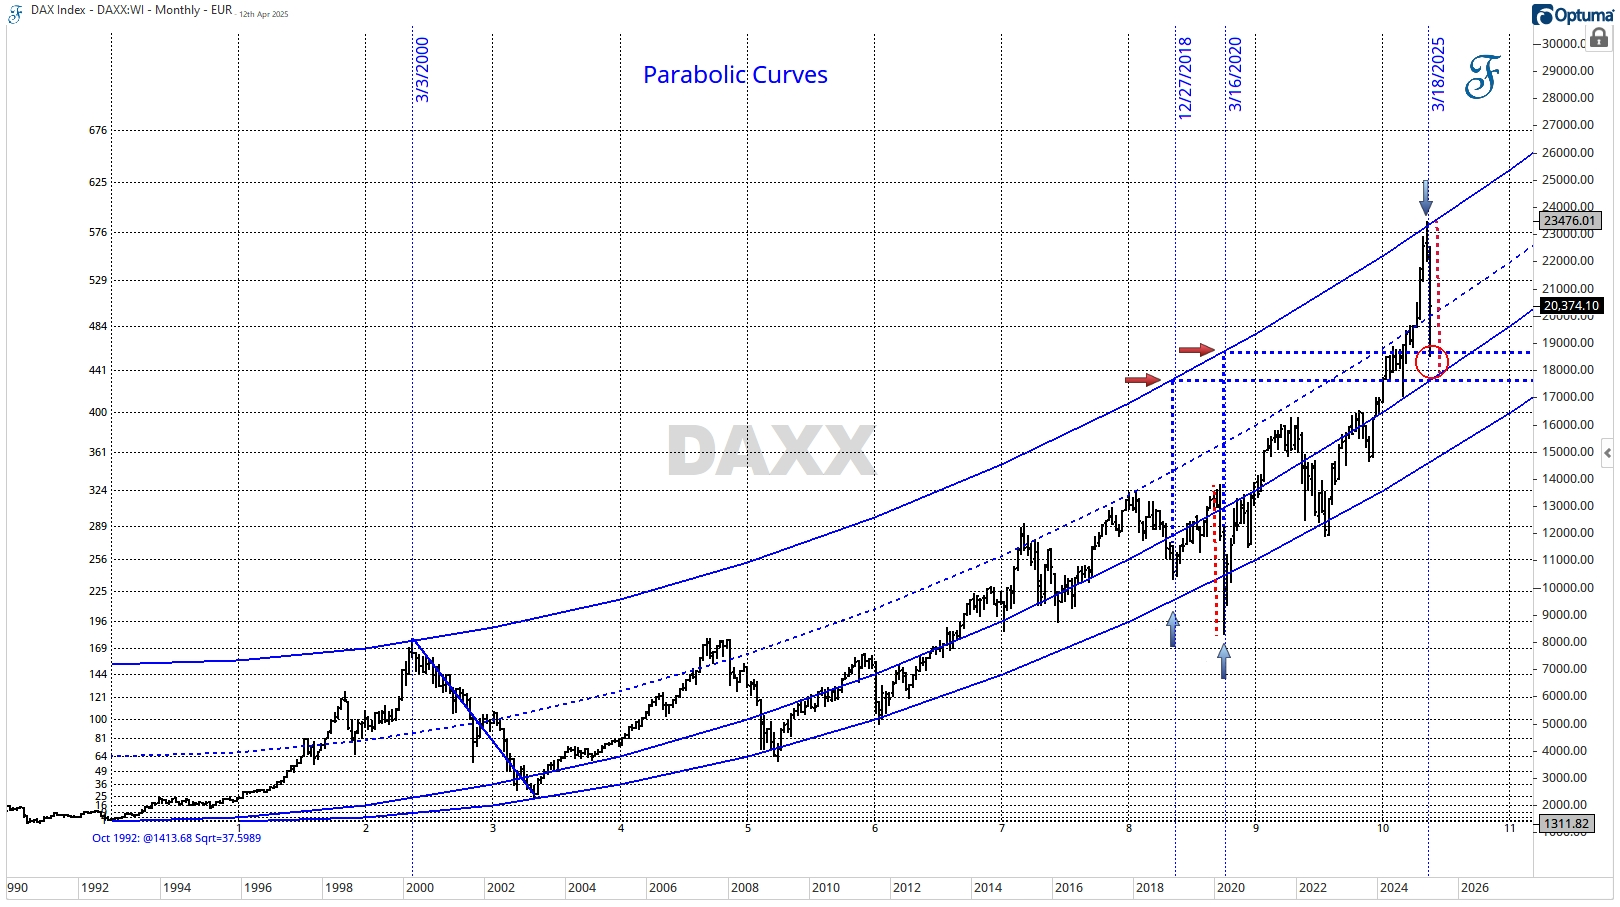
Note: Follow the dashed blue trendlines from the COVID low that make a 90-degree angle with the upper parabolic curve at the current price level.
After reaching the support level, the DAX index recovered to the mid-channel parabolic curve (dashed blue). Ideally, I want to see the lower parabolic trendline square out with the December 2018 low first.
The main US indices may have hit support for now. In this post, we will examine the US indices from various perspectives using Gann timing lines looking down from 45,000 feet, parabolic curves, and a 90 trading day time cycle.
However, even with a notable recovery following last week’s Monday/Tuesday lows, nearly all global indices remain below their daily, weekly, or monthly breakout/reversal levels, as illustrated in the chart below. So I am not ready to confirm a low right now. Five years ago, during the 2020 crash, it took several weeks for investor confidence to build that a low had been established.