
Looking Back from Oct 2022/2023
#217 An update on the US Indices, BTC, Gold and Silver.

Introduction
When looking for a change in trend, I always look for Price and Time alignment. A perfect example in Price and Time, which you do not see very often, is that of Lilly & Co.
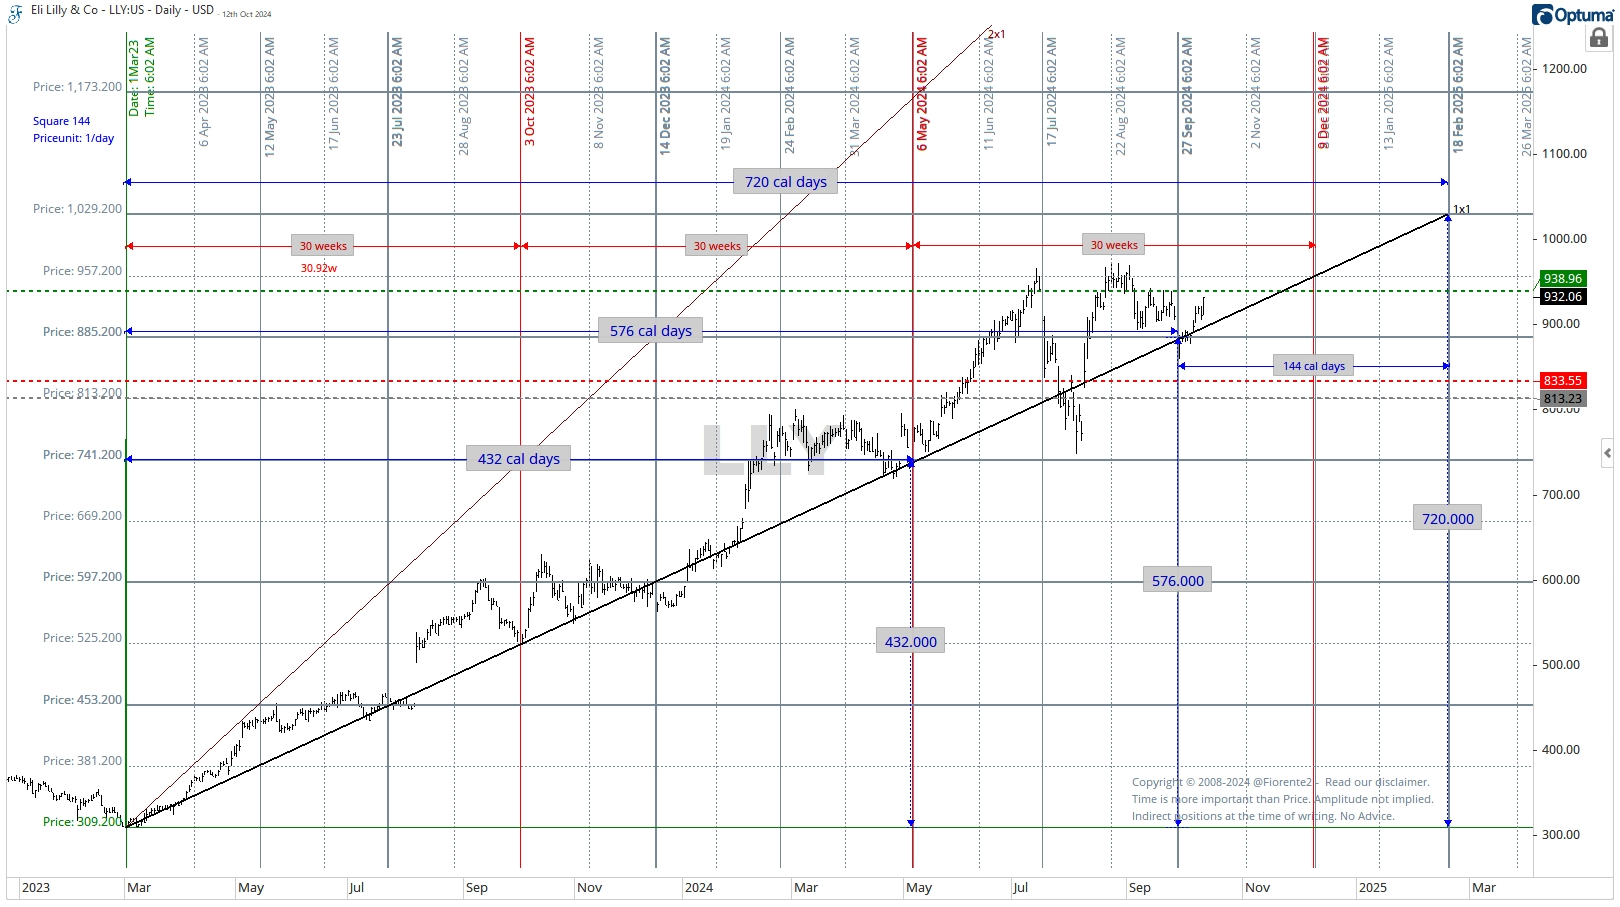
The above chart shows that LLY squares out in Price and Time in 144 days at a rate of $1/day(Calendar day). From March 2023 low ($309.20), LLY moves in 30.92 weekly increments, making a new low on the 1x1 timing line(solid black line). As long as we stay above the 1x1 timing line, I see no reason yet for a change in trend. LLY may move the entire 720 calendar days from the lows of March 2023 towards a price target of $1029 ($720 above the low of March 2023). No advice.
Last week, I discussed the upcoming Mars-Jupiter helio conjunction and its historical impact on market highs and lows on the US Indices. I pointed out the 18- and 9-year intervals between these conjunctions and highlighted the seventh return of this cycle since the low in 2009. Additionally, I mentioned a close 180-degree move in Saturn Helio and questioned whether the market will turn around these cycle moves.
It's possible we are close to a high in the US Indices, but I will show you that the 60-year cycle may not have run its course. Using the square-out technique mentioned above, I am looking back at the US Indices from the October 2022 and October 2023 lows to identify alternative prices and time targets. The US Indices may be close to a trend change or extend a bit further. Moreover, in this week’s update, I will provide updates on BTC, Gold, and Silver.