
Looking Across Financial Markets
#288 An Update On US Stock Market, Currencies, Gold/Silver, Bitcoin and ETF's

Introduction
Since the beginning of the year, significant events have impacted financial markets. I believe the stock market can maintain its recent highs for now, similar to what we saw in late 2021. Last Friday, both gold and silver experienced a sudden decline following the nomination of the new Federal Reserve chairman. While market fundamentals are important, the end of a cycle often plays a more crucial role.
In this post, I will evaluate developments across various markets, focusing on the cycles and patterns we observe. This will include an update on: the Dow Jones Industrial Average (DJIA), gold and silver, US Dollar and Euro, Bitcoin, various ETFs, and some individual stocks that are currently at a six-year low.
DJIA
The economy and the stock market are showing strong resilience. I can’t see the US administration allowing the stock market to drop to a July 4th low during a 250-year celebration of the USA. Therefore, I am considering an alternative scenario.
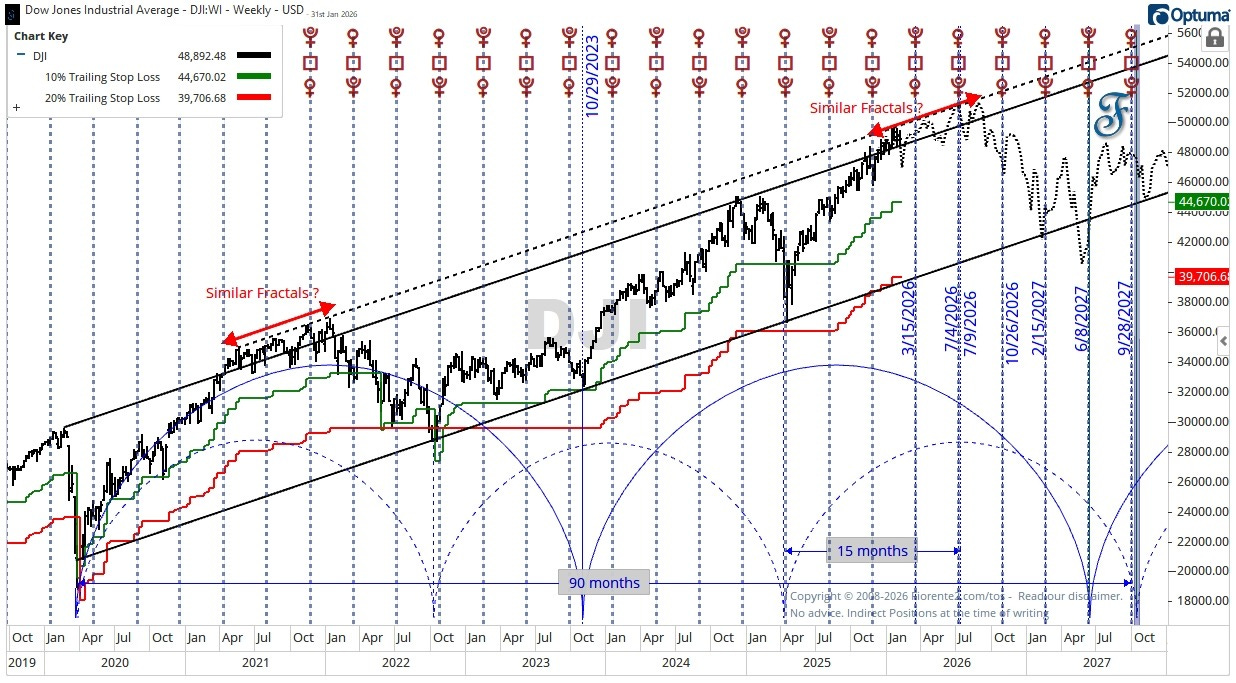
Long-term cycles we studied earlier typically last up to eight months. So, it is possible that the stock market may trade higher into July 4th, 2026. I projected the 2021/2022 fractal into the future approximately 4.5 years ago as a reference.
Even if the stock market experiences a 20% decline (red) from its recent all-time highs, it may still maintain the long-term trend. The 10% drop (green) may likely be the first phase of a major decline.
Gold/Silver
Yesterday, the Gold and Silver Futures declined sharply, apparently due to the nomination of theanticipated new Federal Reserve chairman. While fundamentals can influence the direction of financial markets, in my opinion, the end of a cycle is often the main cause.
Gold Futures
The Gold chart below shows the market turned 3 cycles of 1188.7 in Price at a 3x1 timing line after 1188.7 calendar days from the start in November 2022. Note that 1188 days is equal to 169 weeks, which is equal to the square of 13. Natural squares in time often mark moments when a change in trend may occur.
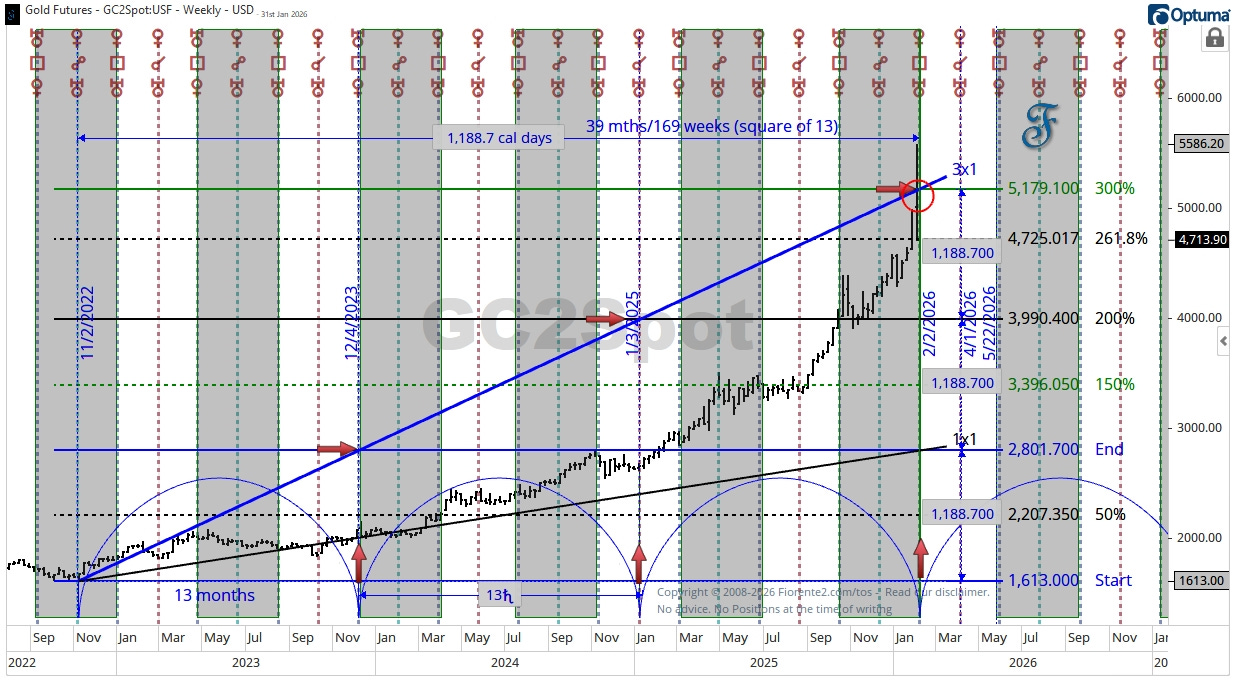
I expect this to be a temporary drawdown, as demand and supply imbalances may favor higher highs in the future. We may see more like a range-bound move to occur between February and May 2026, like in similar periods in the past, looking at the Mars-Uranus Helio cycle.
Silver Futures
A similar pattern may hold for Silver Futures. Price and Time aligned on January 30th, 2026.
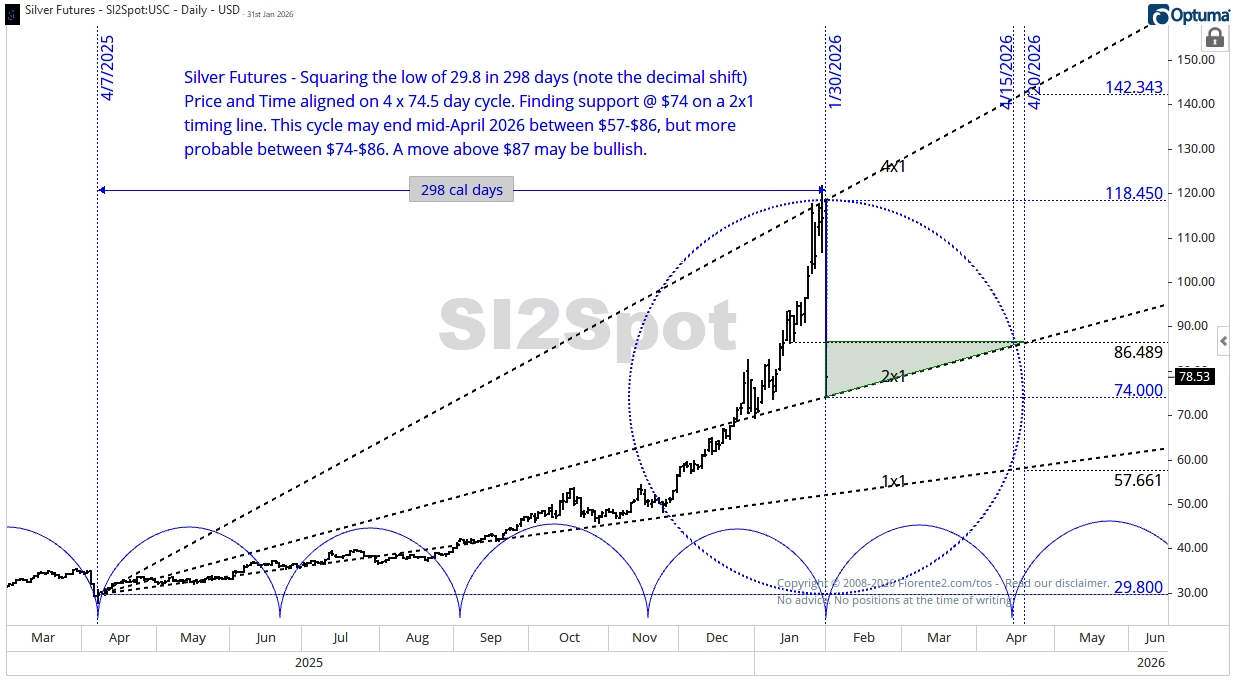
You can see that Silver Futures squared the low of $29.8 in 298 days (note the decimal shift) on a 4x1 timing line. Price and Time are aligned on a 4 x 74.5-day cycle. Also, note the cycle drawn from last Friday’s High to low; it ended exactly at the midpoint of the cycle.
Now Silver found support at $74 on a 2x1 timing line. This cycle may end in mid-April 2026 between $57 and $86, but is more likely to fall between $74 and $86, remaining within the green-shaded area. A move above $87 may be bullish.
USD Index/Eurospot
Following the announcement of the new Federal Reserve chair, the disparity between the USD Index (DXY) and the Euro spot Index reached a possible high, similar to what occurred 8 years ago, when the disparity between the Dollar and the Euro was at its maximum.
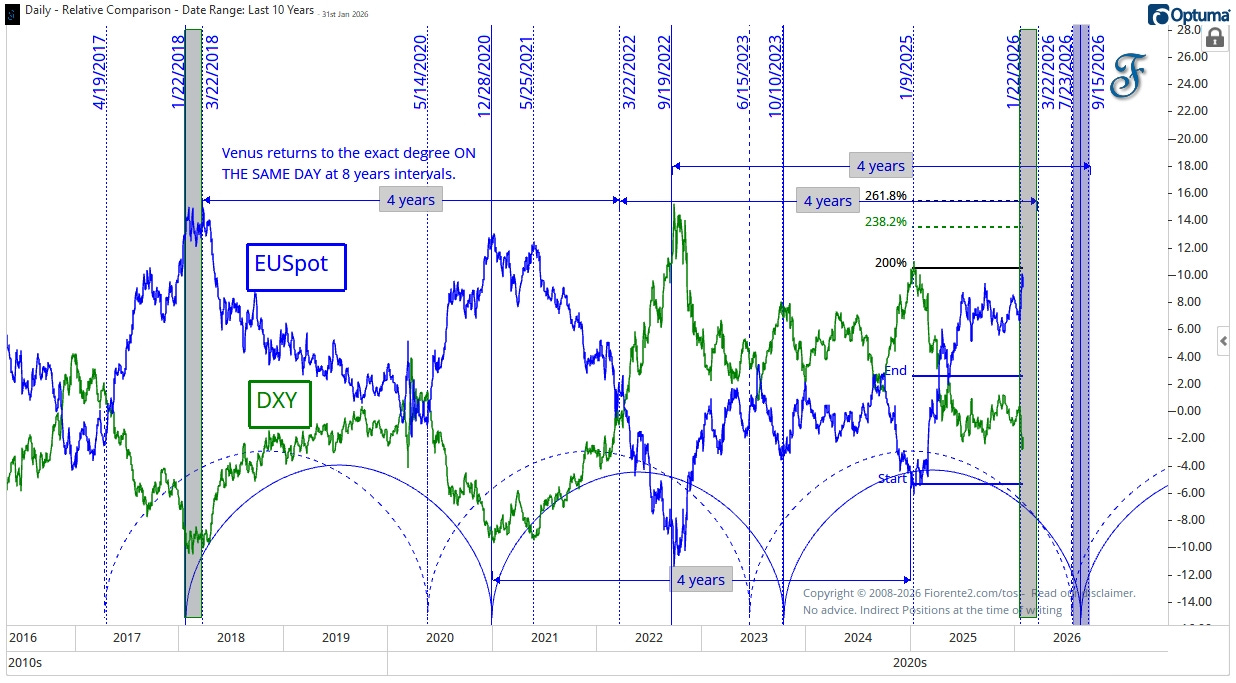
Eight years ago, during the grey-shaded period of January to March 2018, the greatest disparity occurred. This might correspond with Venus cycles, as Venus returns to the same degree on the same day every eight years.
Some Analysts still expect the US Dollar index to decline further, which will advance the Euro; hence, the 4-year cycle may result in a greater disparity by July-September 2026. This then aligns the September 2022 maximum disparity in the DXY and EUspot on a 4-year cycle.
Bitcoin
The 4-year cycle low in Bitcoin is expected around June to October 2026. Last time this cycle in November 2022, it turned around the Mars conjunct Uranus Helio aspect (at the same degree). I have circled these aspects in red.
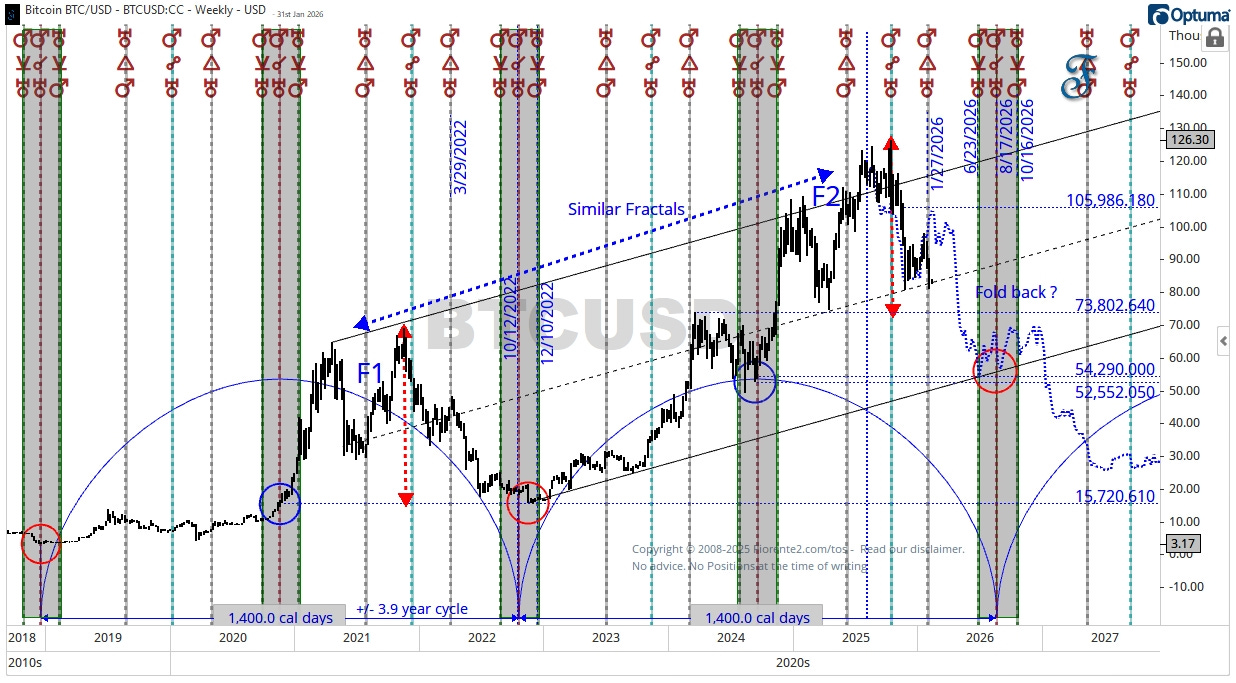
Moreover, you can see in the above chart that if the foldback continues as plotted, turning on the Mars trine Uranus aspect when Mars is at a 120-degree separation from Uranus (January 27th, 2026), a Head and Shoulders Pattern may emerge. This could bring Bitcoin back to the $54,000 price level, anywhere between June and October 2026.
Bitcoin may have found support near the mid-channel trendline. A break below this line may complete the potential head-and-shoulders pattern to a 4-year low in June-October 2026.
ETF’s
Evaluating various Exchange-Traded Funds, I can still see room for higher highs in some of these funds that may carry the stock market into mid-2026.
SOXX - iShares Semiconductor
For the semiconductors, I am looking at a potential high in April 2026, 90 weeks after the previous high in July 2024 and 1 year after the low in April 2025.
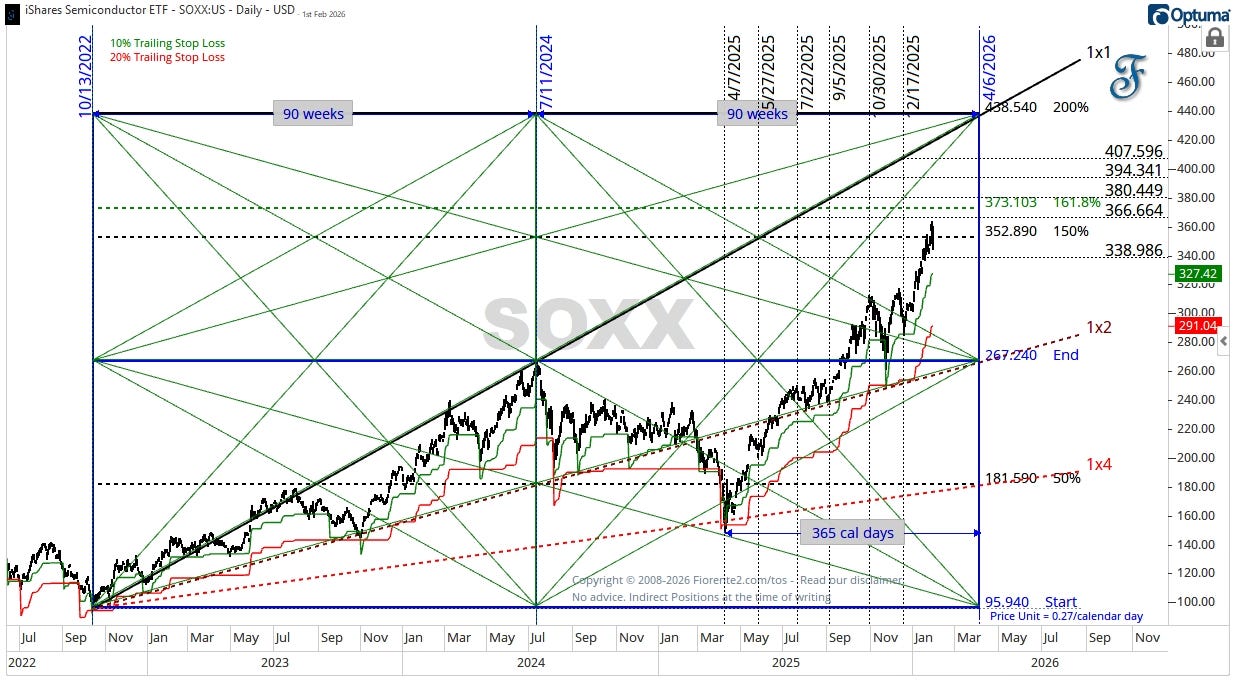
Currently, the SOXX faces resistance at the 150% price level drawn from the October 2022 low to the July 2024 high. There are numerous resistance levels near a potential top, based on past highs or lows (aligning with the 1x1 timing line). At any of these levels, the market could reverse.
There is never a guarantee that any index, stock, or ETF will continue to perform in the same way over time as it has in the past. Anomalies can happen.
The 10% trailing stoploss (green) and the 20% trailing stoploss (red), drawn from the most recent highest high, may serve as useful indicators of where Banksters might have placed their stoplosses. This can vary depending on each trader’s risk-reward appetite and personal circumstances. No advice.
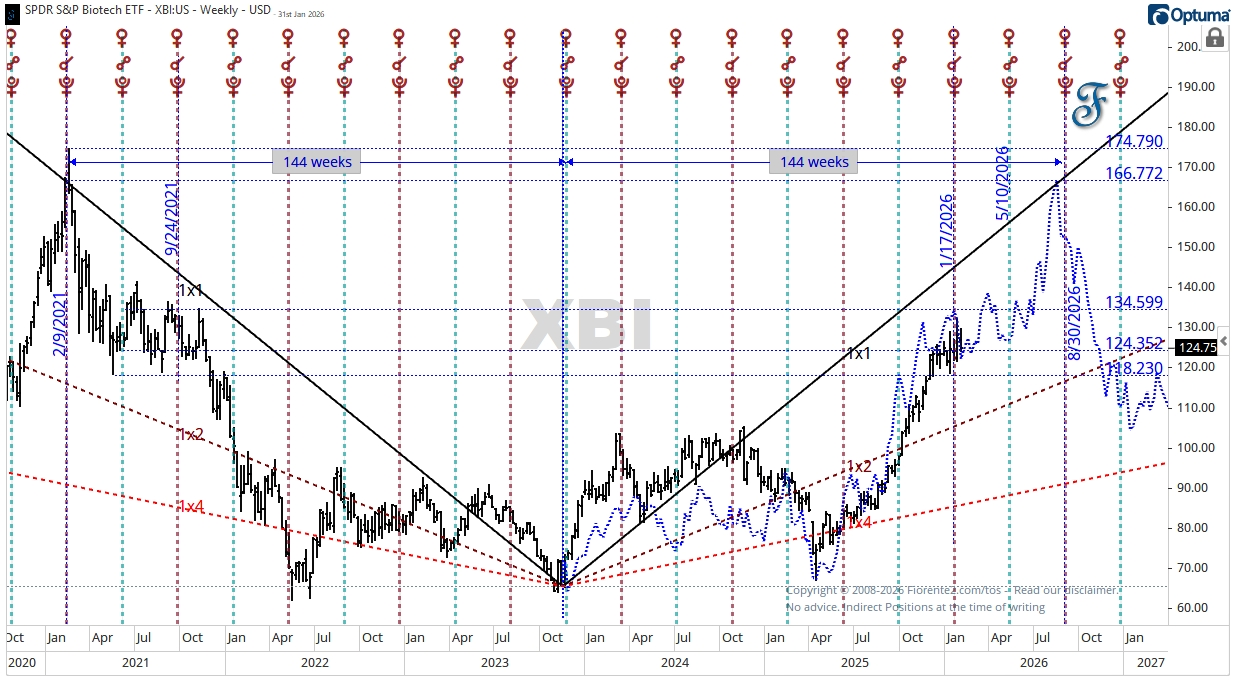
XBI - SPDR S&P Biotech
To date, the XBI Biotech ETF has tracked the mirror-image foldback (dotted blue) shown in the chart below. The foldback may have occurred around the Venus-Pluto heliocentric cycle and could resume when it crosses above the $135 level.
XLB - SPDR Materials Select Sector
The XLB - SPDR Materials Select Sector Index may be at the top of the trading channel formed by 1x4 timing lines. This coincides with an AB=CD pattern. After an AB=CD pattern, we have often observed a correction.
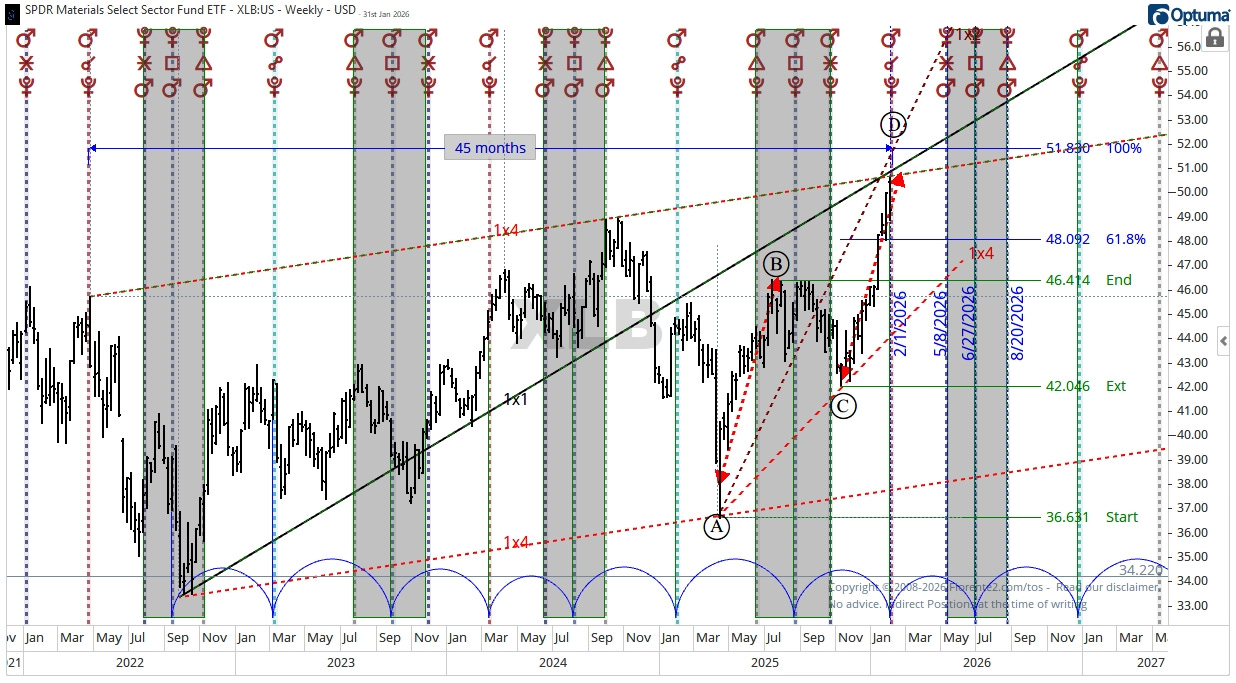
In the last few instances when this ETF reached a high while Mars was at the same degree as Pluto, corrections have set in. If the past is indicative of the future, we may see a sideways move until May-August 2026.
XLP - SPDR Consumer Staples Select Sector
For a while, it looked like XLP, the SPDR Consumer Staples Select ETF, was heading toward a low around May 2026. Recently, it broke out of the downward channel and is now moving toward a high of $88 by the end of May 2026.
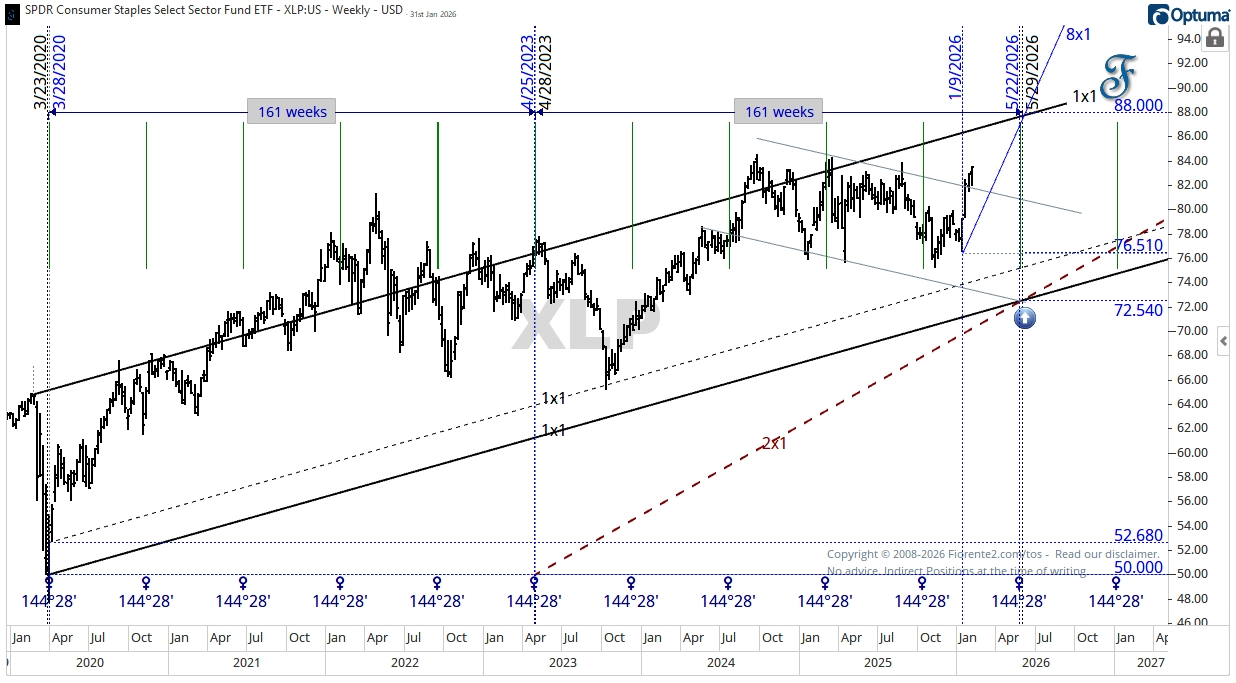
The high at the end of May 2025 may align with Venus at 144 degrees. In the past, I have often observed a change in trend when Venus enters this aspect.
Six-year Cycle lows
In the last few weeks, I have seen some interesting stocks making six-year lows. After two or three years of decline, you may often observe rebounds or even complete foldback scenarios to previous highs.
UPS - United Parcel Service
Recently, UPS reached a 6-year low, which has been in decline since December 2022.
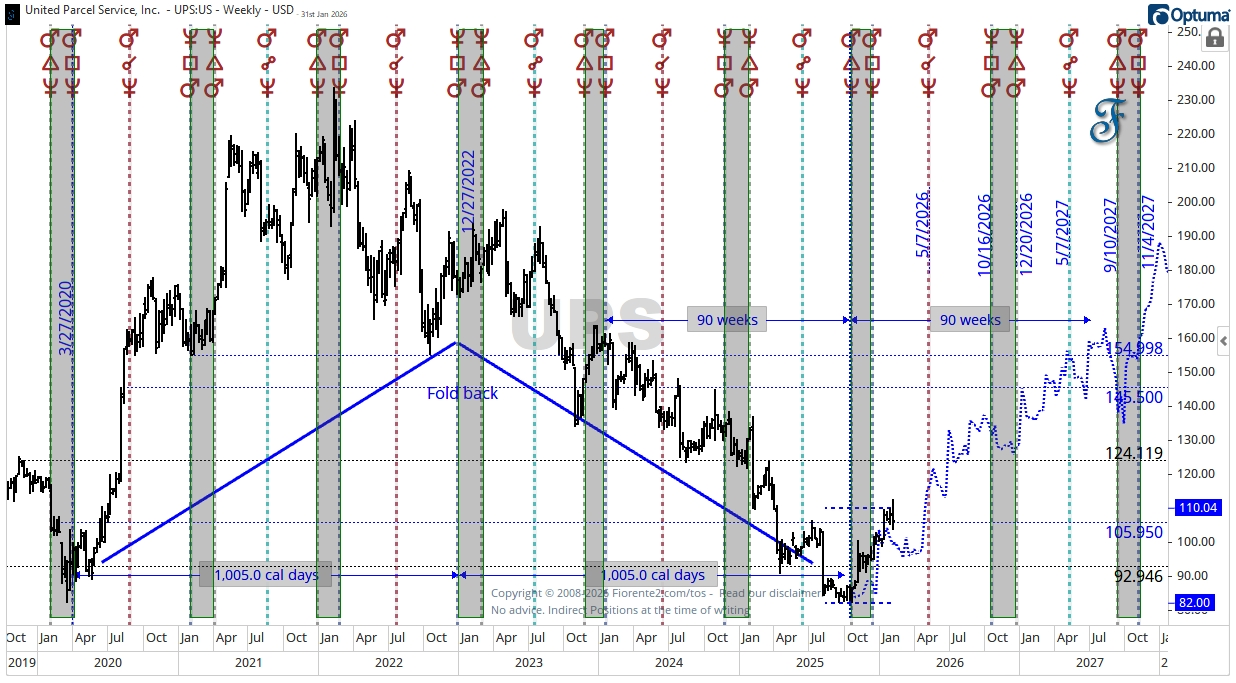
The rebound to the 2020 COVID low likely aligns with the Mars-Neptune cycle. I highlighted the Mars-Pluto aspects where trend changes happened. We might see a similar pattern if UPS can break above the $106 price level. I have plotted a potential fold-back scenario (dotted blue) on the chart.
DOW - Dow Chemicals Inc.
A similar situation may be happening with Dow Chemicals Inc. Dow Inc recently hit a 6-year low and appears to have bottomed. If the speculative fold-back (blue dotted) continues, the stock could return to its previous high levels.
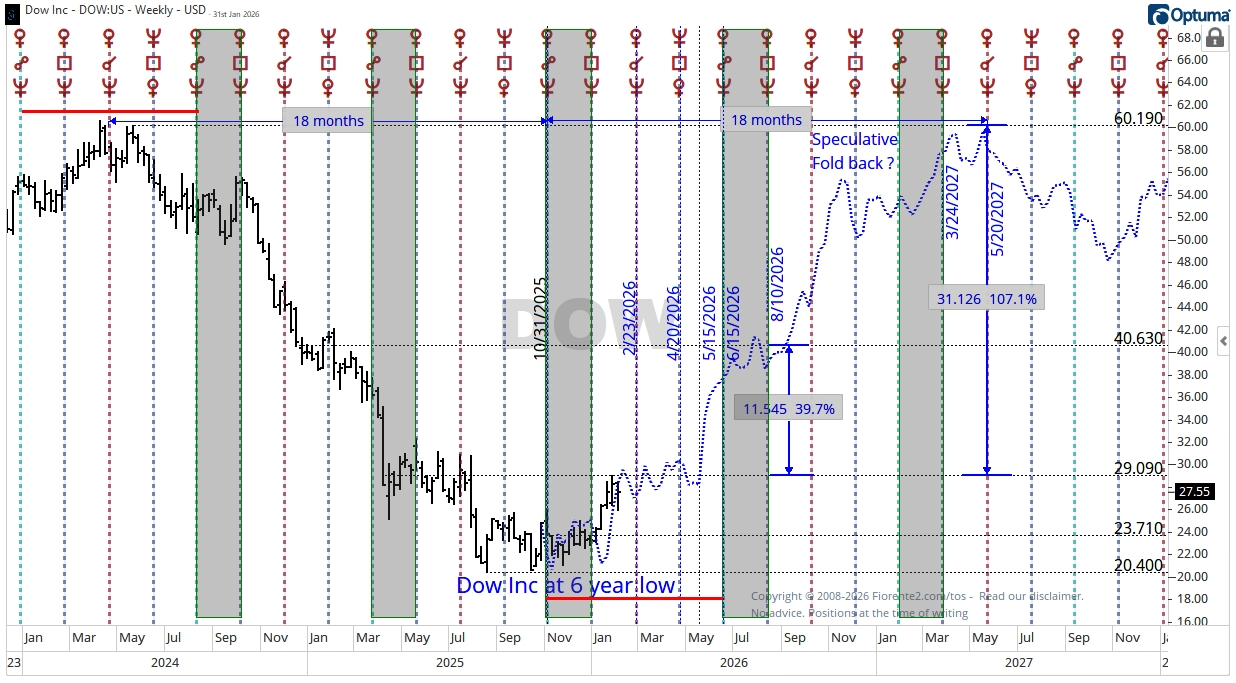
There is a well-known 18-month cycle in the stock market. UPS seems to be changing trends on a 270-degree move of Mars-Neptune Helio. If the recent trend continues above the $29 to $30 price level, we may see the stock rebound into June-July 2026.
Conclusion
In this post, I have analyzed the DJIA in light of a possible repeat of the 2021/2022 fractal. Given the resilience of the U.S. economy and the broader stock market, I do not anticipate the stock market plunging into the 250-year celebration around July 4th, 2026.
Additionally, evaluating ETFs such as XBI and XLP, as well as individual stocks, I can see that there is still room in some sectors to rebound to higher price levels. This might have caused the stock market to remain at higher price levels, as seen at the end of 2021.
The US Dollar Index and the Euro may have reached a maximum disparity on an 8-year Venus cycle. A change may have occurred, although it could be only a temporary pause in a 4-year uptrend towards July-September 2026.
Bitcoin may have found support near the mid-channel trendline. A break below this line may complete the potential head-and-shoulders pattern to a 4-year low in June-October 2026.
This is my current bias across various financial markets. Remember, cycles can contract, extend, and invert. Anomalies can occur, fundamentals can change so be careful out there. I expect quite some volatility ahead of us.
In case you haven’t noticed, I recently posted various charts in the Substack notes. You can find them all here. (click on the link)
P.S.: Occasionally, I share new analyses exclusively for free subscribers. Subscribing gives you email updates on these posts, plus extra insights and deeper research from the time you join onward; past analyses are not included.
If you liked this post from @Fiorente2’s Blog, why not restack and share it?
© 2008–2026 Fiorente2.com. All Rights Reserved.
Disclaimer: This analysis is for informational and educational purposes only and should not be considered investment advice. Read our full disclaimer.
Disclosure: From time to time, I may hold positions in the securities mentioned.