
Has Nvidia (NVDA) Reverted to the Mean?
#236 A Fresh Look at NVIDIA Corporation - Short to Medium Term Trend

Introduction
Nvidia (NVDA) saw a significant stock drop of around 16% on January 27, 2025, losing nearly $600 billion in market value—the largest single-day loss in U.S. stock history. This decline stemmed from concerns about a language model from Chinese startup DeepSeek, which claimed to require less computing power than U.S. models. The news raised doubts about the returns on heavy investments in AI. Other chipmakers like Broadcom and Micron suffered losses, and the Nasdaq and S&P 500 fell. Is the boom in NVDA’s stock over, or did NVDA revert to the mean?
Let’s have a look at the longer-term trend using a weekly chart.
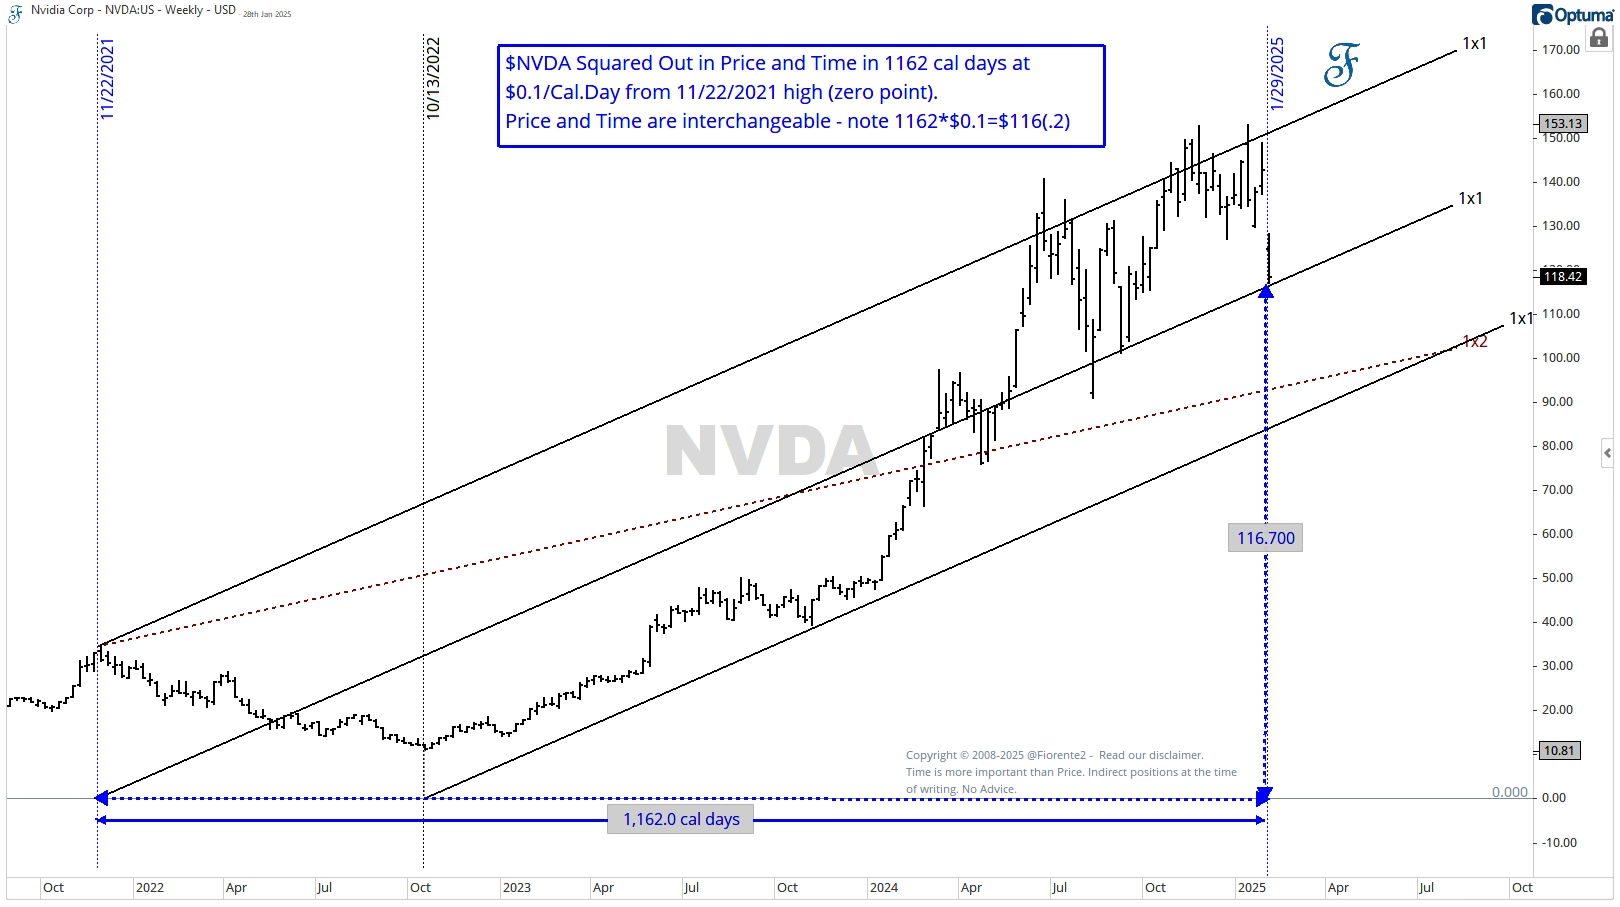
As shown in the chart above, the price level of $116 for NVDA fell precisely 1162 days after the November 22, 2021, high, measured from the zero point beneath that high on this 1x1 timing line. This is at a $0.1 calendar day vibration rate. Note: 1162*$0.1 =116.2(calendar days).
👉 Today’s takeaway: Price and time are interchangeable, and NVDA might have discovered support that aligns with natural laws. However, this doesn't mean NVDA cannot decline further below this 1x1 line, so let’s explore possible scenarios for how this might progress.