
Gann Master Cycle update - July 28th 2023
Will Square of Nine price levels meet with cycles in the DJIA, SPX and the Nasdaq composite?

Introduction
We are approaching a cluster of cycles from important highs and lows, which may be a probable period for a change in trend.
Last week I discussed the Mars Uranus cycle, which will have a cluster of cycles coming together from the 2009 and 2020 low end of July to early August 2023. As mentioned:
“This cycle lasts about two years or 702.2 Earth days, during which Mars returns to the same position relative to Uranus. Financial astrologers find this cycle fascinating because it's believed to be associated with changes in energy, innovation, and sudden shifts in the stock market.”
From a square of Nine or a Gann wheel perspective, we approached the next level from the October 2022 low last Friday, as shown in the chart below. You can see in the inserted Square of Nine Wheel that 289 calendar days is the opposite of the price level of 101(00) at the trough of October 2022, which is on the same price angle as the high in November 2022.
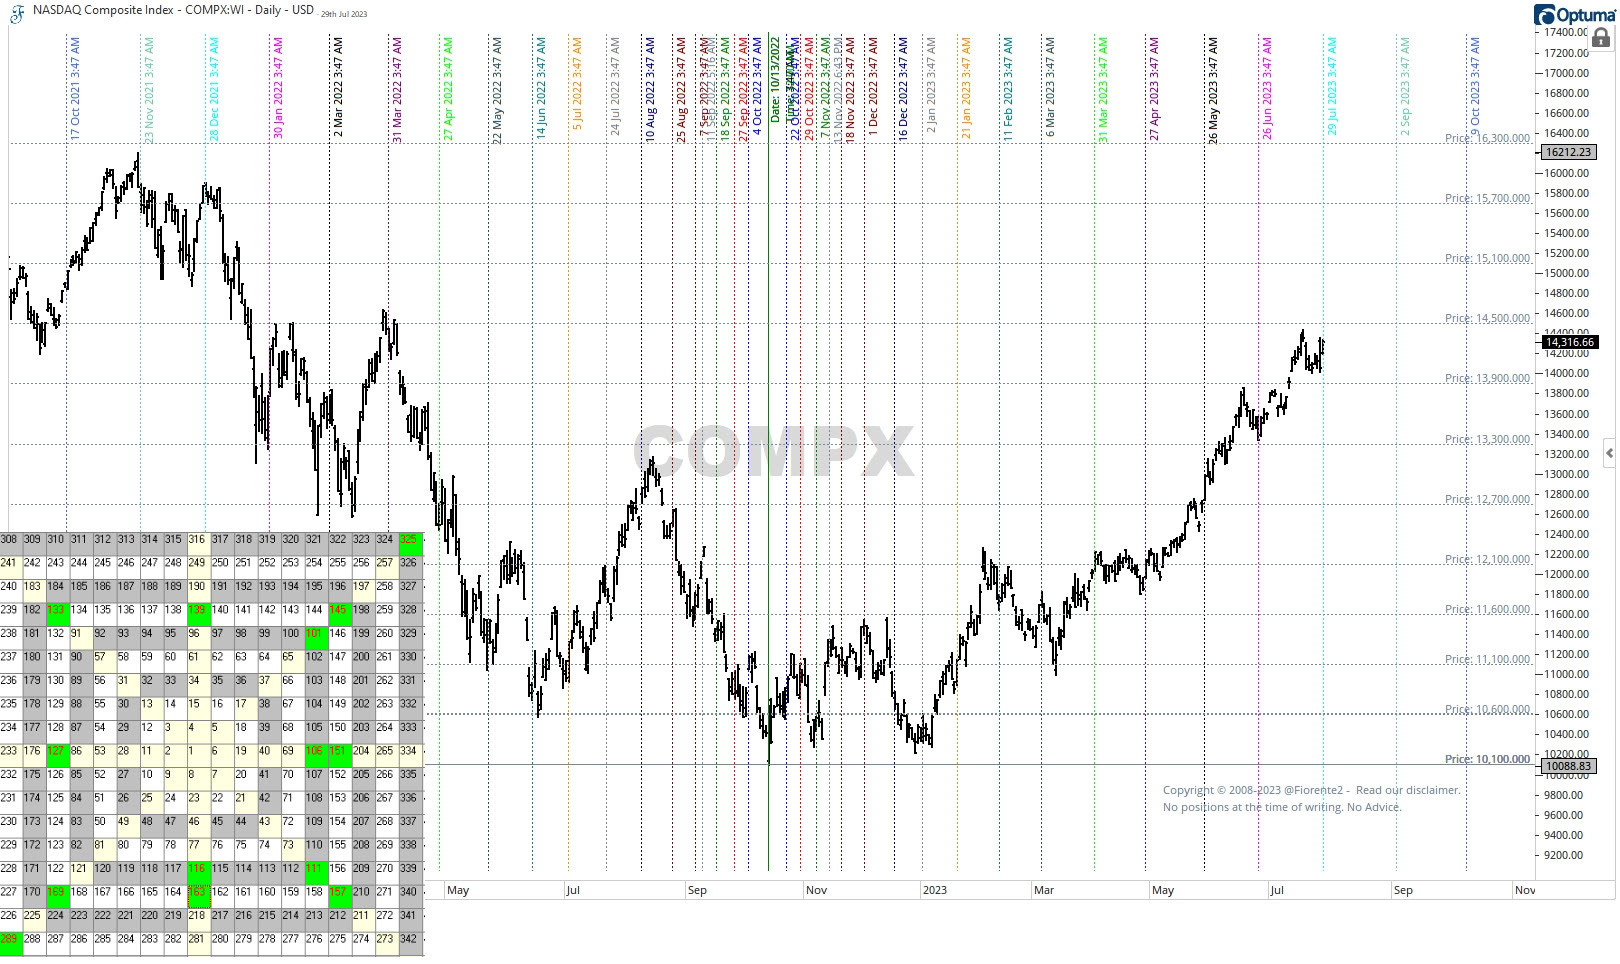
This may be an important point in time. Natural integer squares are good numbers to use for a square out in Time, particularly when they meet a square in Price. The dates in above chart are natural squares to either side of the October 2022 low. The price levels on the chart follow the cardinal cross and ordinal cross on the Gann Wheel (highlighted in Green) with numbers reduced to three digits.
The next square-out level is on September 2nd, 2023. This is 324 (square of 18) Calendar days from the October low of 2022.
The price level of 145(00) on the ordinal cross is on the same angle as with the low of October 2022. 151(00) is on the cardinal cross. Both can price levels could imply a square out in price and time if price and time align on September 2nd, 2023. Note: the low of October 2022 was 101(00). The next cycle around the wheel is 145(00). A new cycle may start.
In this update, I have added square of Nine price levels and planetary cycles to the various charts. There is a higher probability that a change in trend may occur when these are in alignment. As mentioned in last week’s post, the seasonal trend of the major US indices favors a seasonal high in July and a seasonal low in October of the year. We may be close to a trend change, but note that 36 years ago (1987), the high was not set earlier than at the end of August. Similar to 1929 (early September). A 0.618 Fibonacci relation between 1929, 1987, and 2023 is very interesting.
This analysis is intended for general informational & educational purposes only. Hypothetical or simulated performance based on past cycles has many limitations. Cycles can contract, extend, and invert. Anomalies can occur. Hence, past performance is no guarantee for the future. No advice. Please take a look at our full disclaimer.