
Gann Master Cycle update - Aug 4th 2023
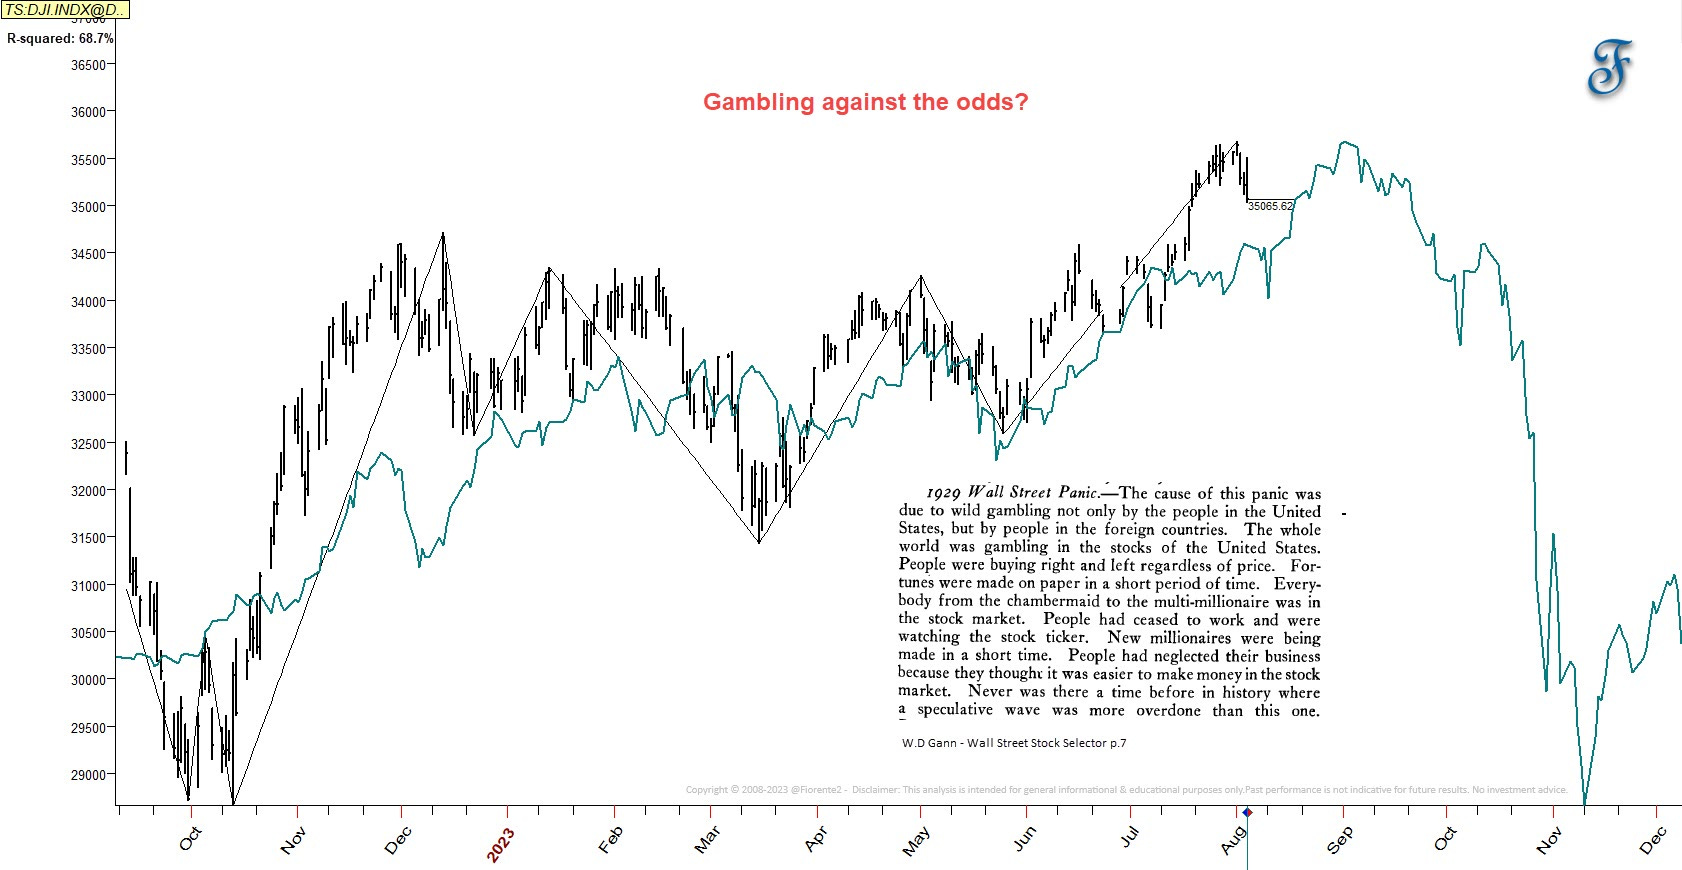
Gambling against all odds - A cycle update following the US Indices

Introduction
Since ChatGPT was announced in November of last year, the Nasdaq has reached highs that have surprised many investors. This year’s surge in the market has shown similarities to the market in 1929, especially since May. It begs the question: are investors and traders taking a gamble despite the odds?
On September 3rd, 1929, the DJIA hit its highest point at 386.10. If we take this high and multiply it by one hundred, the total comes out to 38610 in just a little over 34333 days. Even though the outcome isn't a perfect square, it's still feasible if the 60-year Gann Master Cycle continues.
As investors, we're often curious about where the market is headed. It's important to remember that the stock market has seasonal patterns, with cycles that repeat themselves. We can gain insight into the likelihood of future crests or troughs by analyzing past trends.
There is a fascinating Fibonacci correlation of 0.618 between the panic dates of 1929-1987 and the potential for a market downturn this fall. It's important to note that this is not a guaranteed occurrence. Long-term cycles typically switch polarity in the following cycle, which means a low in early September 1929 is possible. In the previous week's post, we discussed the next square-out level, which falls on September 2nd, 2023. This date is precisely 324 (the square of 18) calendar days from the October low of 2022.
I will investigate the stock market's potential future by analyzing historical patterns in this update. With the market being heavily influenced by the advancements in Artificial Intelligence, I have also utilized AI to predict the market's direction for the upcoming months. The results may be unexpected. As an investor, I tend to go against the crowd, as it is often the case that people are wrong when panic sets in. Due to the length of this weekly episode, it may not all fit into one email, but premium subscribers can access the complete content online.
This analysis is intended for general informational & educational purposes only. Hypothetical or simulated performance based on past cycles has many limitations. Cycles can contract, extend, and invert. Anomalies can occur. Hence, past performance is no guarantee for the future. No advice. Please take a look at our full disclaimer.