
Do not try to catch a falling knife
#208 Update on DJIA, SPX and Nasdaq and the concept of 'Lost motion"

Introduction
‘Do not try to catch a falling knife’ is an adage that often applies to stock market lows and is often forgotten by traders/investors to step in too early, whilst ‘another fast-moving train’ was coming on its way to make an even lower bottom.

As expected, the stock market reached a low in early August. Often, a second low follows shortly after important lows, as I mentioned almost two years ago in a similar post
Cycles synchronize at the bottom of the stock market, and a change in trend will not occur until these have bottomed. So, always wait for the confirmation that a bottom has set in. For example a higher high and higher low in the stock/index or indicator may help to identify this.
Why does a second low often occur after an earlier low, such as in a double bottom? W.D. Gann explained this in his Stock Market Course, comparing machinery and discussing the concept of lost motion.
“As there is lost motion in every kind of machinery, so there is lost motion in the stock market due to the momentum, which drives a stock slightly above or below its resistance level…but when it slowed down, it would finally settle on the exact center”. W.D. Gann Stock Market Course.
Connie Brown explained in her book The Thirty-second Jewel (p365-366) how to see if there is still lost motion left in the machinery of the Stock Market using detrended oscillators on two charts in a 1:4 ratio. When both oscillators are in sync there is a higher probability there is no lost motion left.
I will show below charts how that works for the Nasdaq. You can apply it to any financial market.
Lost Motion
The chart below for the Nasdaq Composite compares a detrended oscillator in two different timeframes (1 day and 4 days—a 1:4 day ratio).
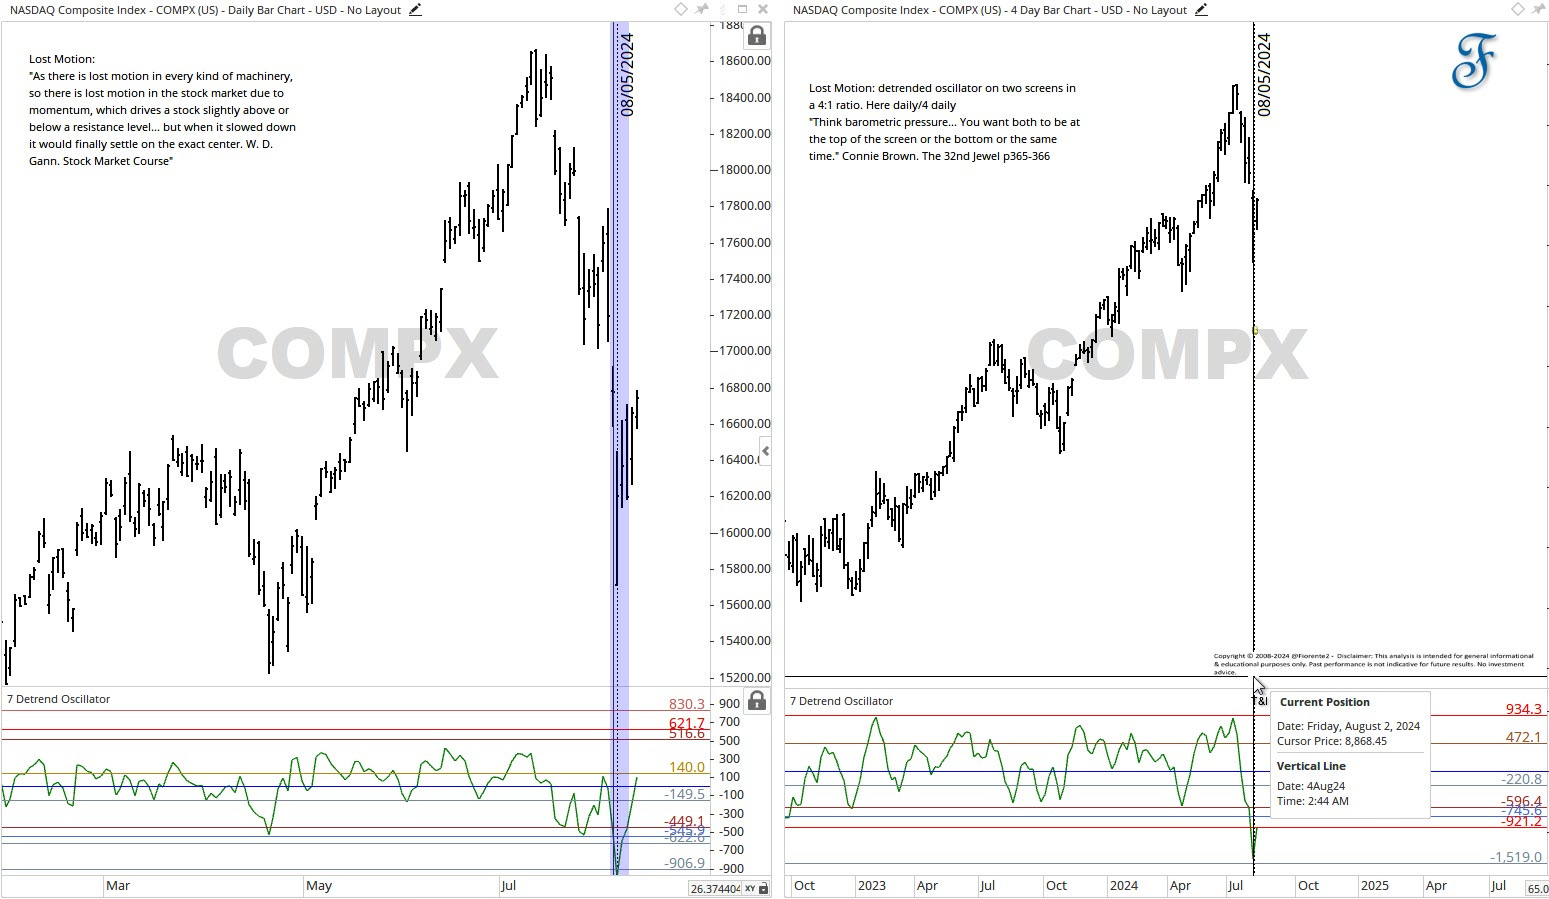
The screen above confirms that a low may have been established on the shorter timeframe. However, as indicated on the next screen, the longer-term cycles may not have fully played out yet.