
$DJIA monthly update October 29 2021
Is $DJIA connecting the 1929 top on a square root scale soon?

The $DJIA is now at its highest level
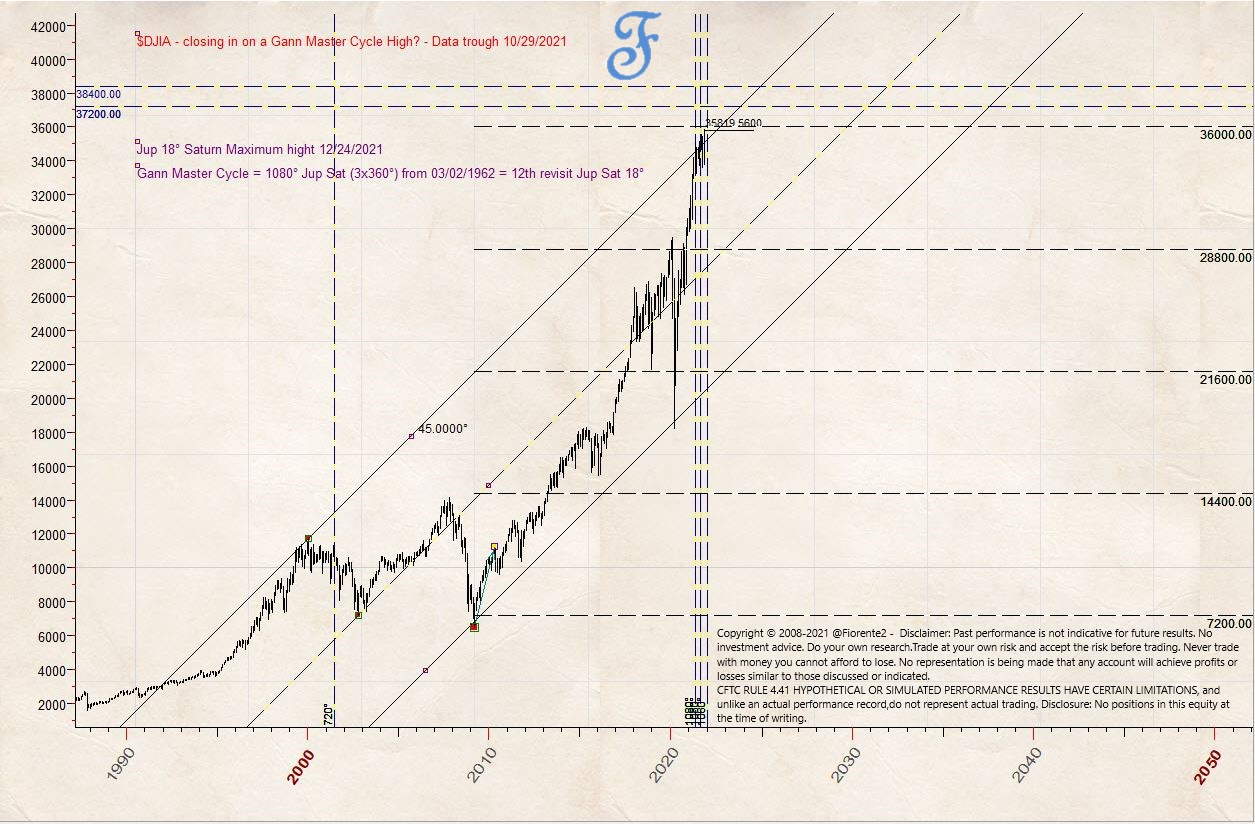
As discussed in my earlier updates on the Gann Master Cycle I expected the $DJIA would move to higher levels towards the end of 2021. The $DJIA has reached its highest close @ 35819.56 on October 29th 2021.
From a planetary, time and price perspective I expect we are not far off from a change in trend (CIT) on the $DJIA.
I will discuss in this update the significance of the levels we are currently trading, based on a few different charts explaining the Jupiter-Saturn Cycle to the current trend, the upcoming planetary resistance levels, how the top of 1929 is very close to a possible square out in price and time in 2021/early 2022 on a square root scale. In conclusion I will discuss the current position at the top of a trend channel drawn from 2000 and 2009 levels.
The significance of the Jupiter-Saturn Cycle
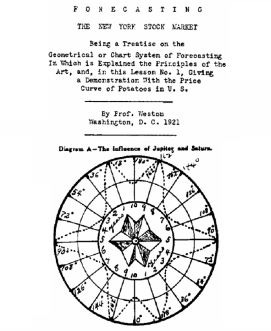
Back in 1921 Prof Weston researched the cycles in the New York Stock Market and he found out that the Jupiter-Saturn cycle was a very reliable cycle with an approximate cycle length of 20 years. From conjunction (0°) Jupiter-Saturn moves in about 10 years to 180° forming the 10 year cycle, and backwards again in about 10 years to conjunction making the total move to about 20 years. The Jupiter-Saturn cycle at 3x its length (3x360=1080 degrees) is in my opinion the Gann Master Cycle.
According to his analysis the cycle reaches is maximum height at Jupiter 18° Saturn in the first year from conjunction. Since its conjunction on December 21st 2020, there are however three passages from Jupiter and Saturn @18° on May 30th, August 25th and December 24th 2021. This may explain why we are still continuing on the current trend towards the last passage.
The below chart roughly indicates the ever repeating pattern during its 10 year interval from 0° to 180°. This has not changed much since this chart was made.

Planetary Resistance lines
I expect the last passage Jupiter 18° Saturn on Dec 24th 2021 to be very relevant for a CIT as it is close to many other cycles discussed in previous updates.
In below monthly chart of the @DJIA I have plotted the passages of the Jup Sat 18° separation at 360° intervals. In 2001 the $DJIA plunged after this passage into the low of 2002. Likewise a CIT occurred around the last passages in 1982,1962, 1942.
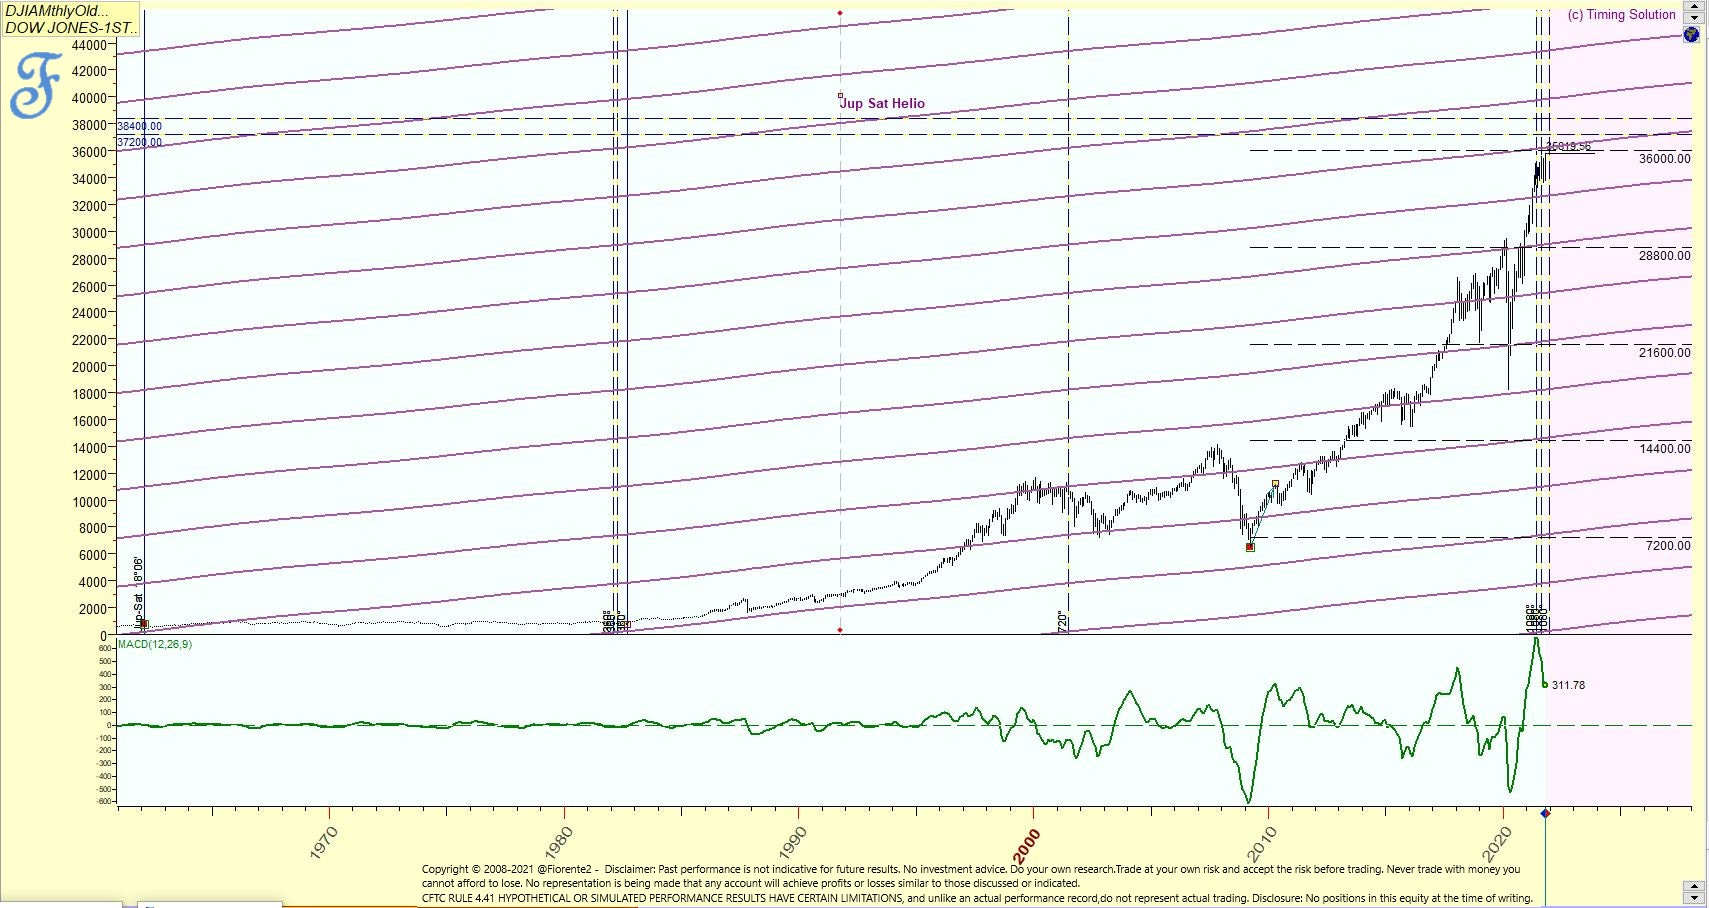
The current level of the $DJIA is very close to the Jupiter Saturn helio planetary lines plotted on this chart and many times in the past these planetary lines have provided for relevant support and resistance.
I expect a price level of 36000 on the $DJIA to form quite some resistance as this level is also an harmonic of 360°. As you can see in the past these resistance levels can form quite some resistance for a while, and in some instances were only passed for a short period after which a CIT occurred and a quick drop in price occurred.
Also note the MACD indicator on this chart is making lower lows for some time, indicating we are close to a probable top.
$DJIA on a square root scale
The $DJIA on a square root scale is also indicating we are close to a probable top. A square root chart is probably the best way to plot a long term chart as opposed to arithmetic or logarithmic charts which tends to exaggerates price movements at its respective high prices or low prices. H.M. Gartley (of the famous "Gartley pattern" ), stated in his 1935 book, "Profits in the Stock Market", that, in contrast to arithmetic and logarithmic scales, "The square root scale, measuring changes in increments of square root, tends to allot equal graphic distance to price movements at all levels."
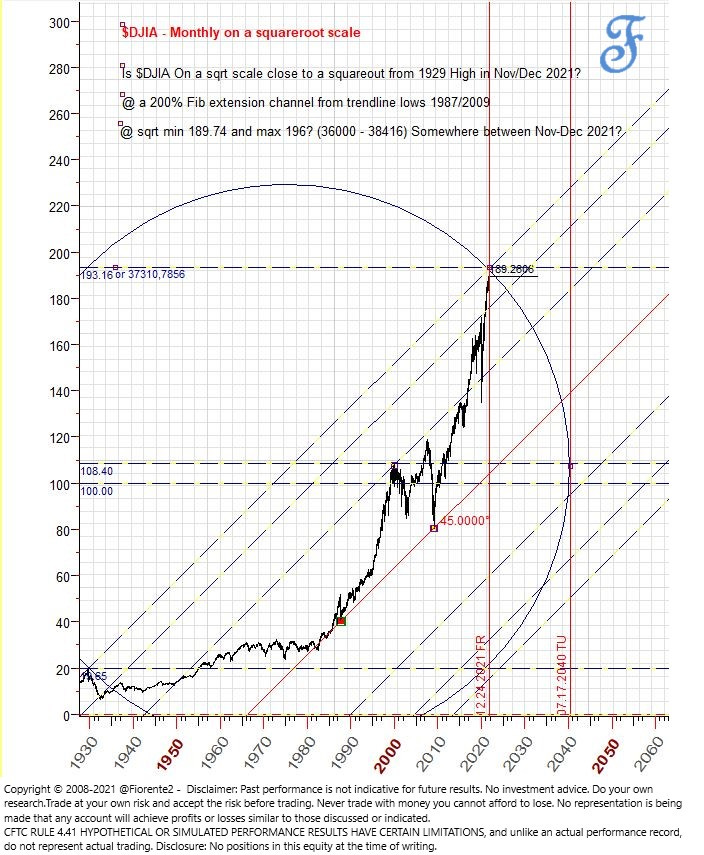
As you can see in above above chart the $DJIA is closing in to a level where the highs in 1929 and a probable high in the next few months are connected from a geometry point of view. A square root of 192 (=36864) or even 196 (=38416) is not impossible to be reached in the coming weeks if this trend keeps extending its course. 192 is on the 24 wheel and 196 is a natural square as well, all levels that can indicate a CIT.
Conclusion: $DJIA is probably at/near top of its trend channel
The $DJIA is also trading at the top of its trend channel, drawn form 2000 top and 2009 low on a 45° angle. Note the mid channel line is going through 2002 low as well. Usually these trendlines are relevant support and resistance levels and where a square out in price and time (CIT) can occur.
I do not expect we will be trading long above this channel, but anomalies can occur, cycles can invert, extend and contract as well. Read my earlier posts on this substack and Fiorente2 Twitter account in the last year as well. So, take care and trade the chart in front of you. Have a good weekend to you all.
Disclosure: No positions in this index at the time of writing. Read our full disclaimer.
PS: I am preparing a special publication: The Fiorente2 - Yearly Stock Market Outlook 2022. Stay tuned for further notices and let me know if you are interested in reply to this post and what you like to be included in this 2022 Stock Market Outlook.
I have decided that the first 333 subscribers to this exclusive publication will get a 66.66% discount on the regular price. The next 333 subscribers will get a 33.33% discount, and you can guess all of the next 333 subscribers and beyond will pay the regular price (probably $99). Stay tuned and let me know if you are interested.
Thank you for your kind words.
Hi Fiorente, where can I sign up for the Outlook 2022?