Introduction
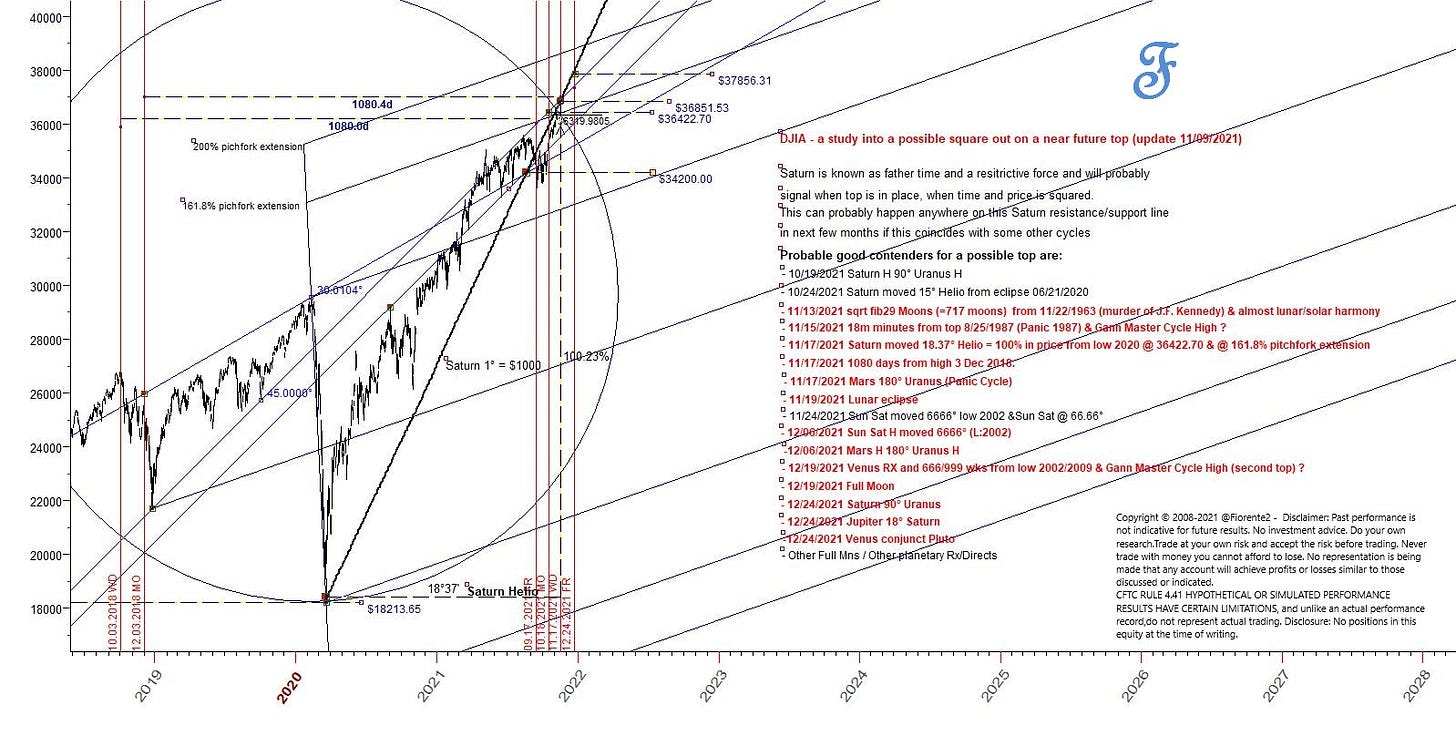
The $DJIA is closing on on the Gann Master Cycle top. Although we have a little more to go the geometry, probably some Fibonacci targets reached and planetary positions imply we could have reached the top already on Monday 8th 2021 @ 36565.
Last time, on the previous Gann Master Cycle, the $DJIA made an earlier top than the S&P 500. Hence, it is well possible as not all instruments/indices turn at the same time on a stock market high.
Gann Master Cycle update
There is little room to go on the Gann Master Cycle for the $DJIA. The index could still meander in a topping phase for some time at the current level or even higher. From the looks of it, it looks like the DJIA could be trading in a wave 4 of 5 of some larger degree.
Recent High and the Planetary Positions
As I demonstrated on the last S&P500 update last weekend, when planetary longitude equals a price level this may also be an indication for a possible crest or trough. This could also be a temporary change in trend before the next wave sets in, but as you can see the current levels of the $DJIA hit already some planetary positions, like Venus and Mercury at the high on Nov 8th. Perhaps we have to wait until price equals longitudes for Mars, Saturn, Jupiter, Uranus, Neptune, Pluto, but we are very close to them as well.
Geometry and Fibonacci Target reached?
From a geometry point of view, drawing an ellipse from the high to low in 2020, the $DJIA has hit the target high on Nov 8th as well. Further, the $DJIA hit from beneath the Saturn planetary line (1° = $1000), which could form quite some resistance. The Fibonacci 1.618 extension on the pitchfork drawn was also reached. It seems as if the DJIA was drawn to this hot spot in time and longitude. Also a level of 36000 is an harmonic of 360°. Is this cycle complete? Let me know your opinion in reply to this post.
Conclusion
I am not advising and I am not yet calling or confirming a high, but the current levels are reason to be vigilant for an upcoming change in trend if the index is not already at that point.
We could still go higher on the $DJIA in a wave 5 of 5 of some degree, or meander for some time in a topping phase until other upcoming major cycles in November and December 2021 have completed their course ( as indicated in above chart). It could be worth watching what the individual stocks part the $DJIA index are doing as well.
As always we do not trade the forecast, but the chart in front of us. Be careful out there.
Disclosure: No positions at the time of writing. Read our full disclaimer.


great work, sometimes it helps to look at other indices. The Dax chart tells me, there is more room to the upside. I think you are right about the 4th wave. I hope to see 4610 or even 4560 before wave 5 will start.
Nice work ----- odds do favor some type of top between now and Feb.