
Did Silver Futures Experience a Premature Breakout?
#304 | Silver futures: case study of a failed breakout from a symmetrical triangle

Introduction
In early May, Silver Futures appeared to break out above a consolidation phase. Analysts were posting bullish setups. Tavi Costa here on Substack posted the chart below on May 7th, 2026.
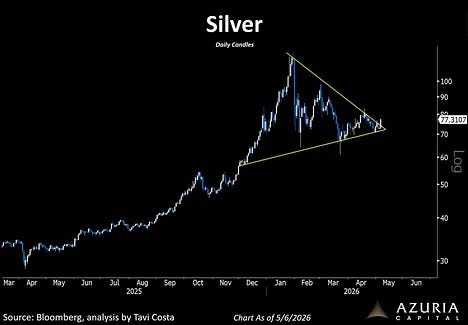
I respect Tavi's work. But the volume wasn't there. On Bulkowski's data, a symmetrical triangle that breaks out before the apex without volume confirmation resolves to the downside around 82% of the time. So I posted a reply directly in his comment section:
“I am not so sure, Tavi, the symmetrical triangle breakout does not seem to be supported with significant volume. Probabilities (82%) may still favor a downside breakout.” 1
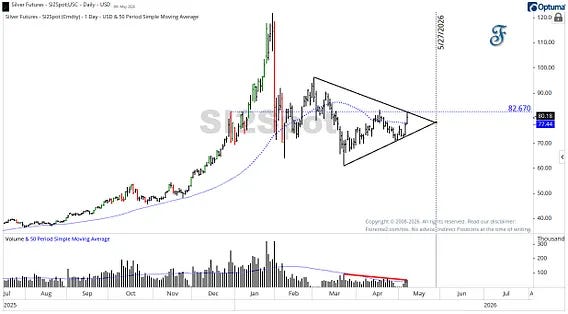
Breakouts before the apex have tended to fail and throw back inside the pattern, or reverse around the apex itself. The apex here was expected around May 27th.
Silver Future - Premature Breakout
Within a week, Silver futures were still trading at low volume. On Friday, price threw back inside the symmetrical triangle.
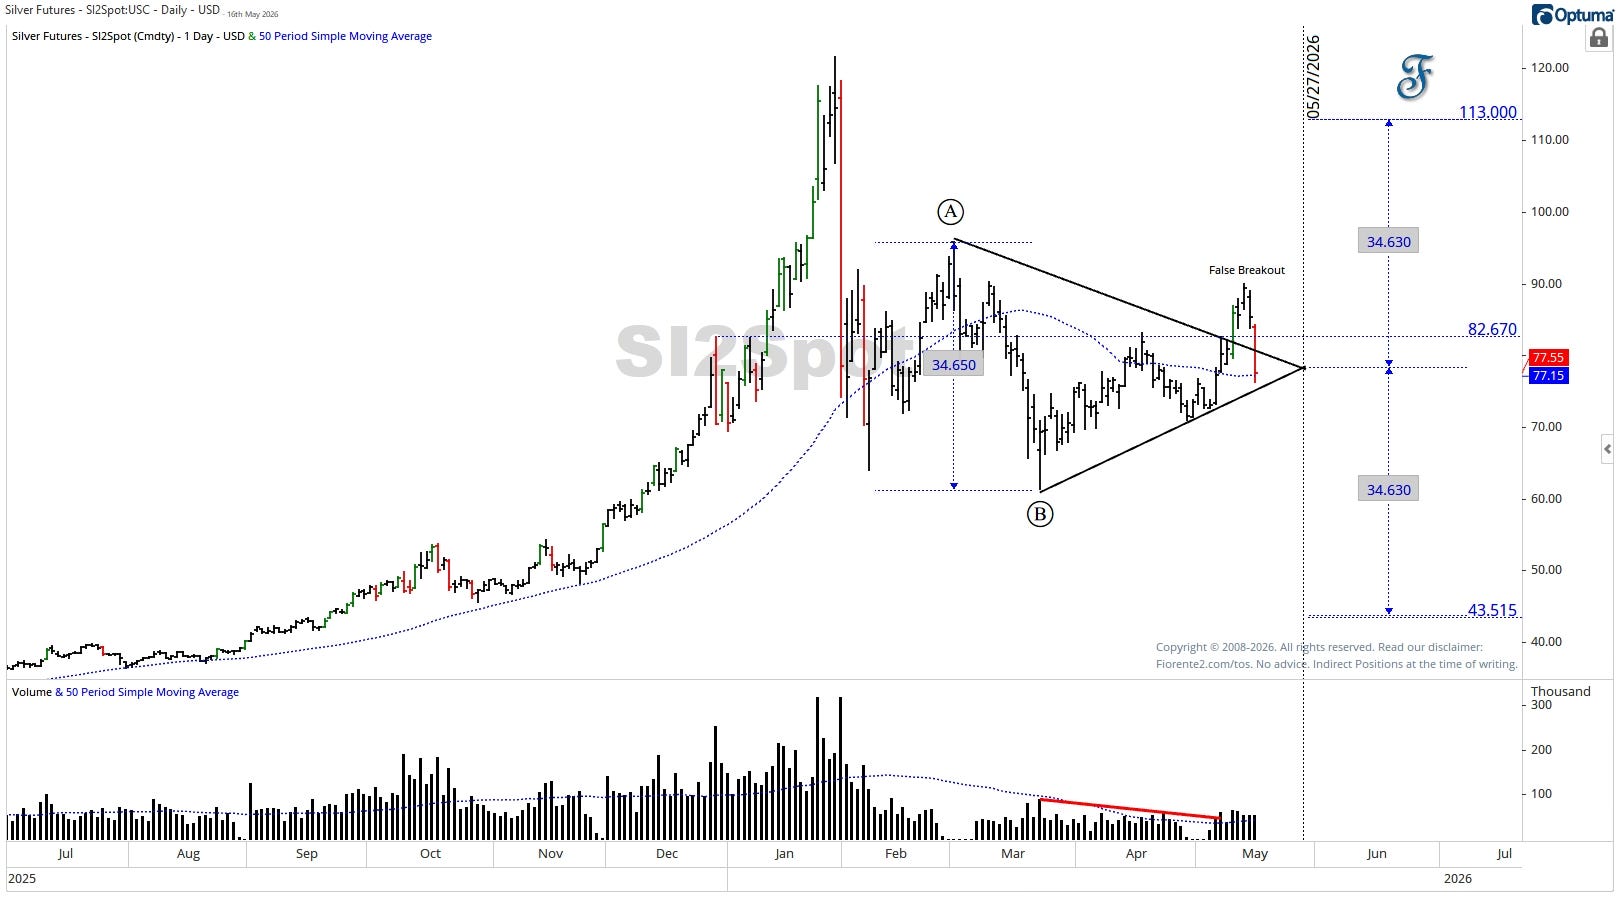
Watch the lower trendline. If Silver breaks below it, Bulkowski puts the probability of a continued decline at around 79%. In roughly 57% of those cases, the full measured move from apex to trendline extends below the breakout point. 1 Volume stays the key qualifier: low-volume breakdowns have tended to underperform the projected target. Bulkowski's study puts the most likely decline in the 10% to 19% range.
A first break below often leads to a brief pullback toward the lower trendline before the downtrend resumes. Wait for a confirmed break, and keep in mind that price can still reverse around the apex.
The pattern on Chart 3 reads as a consolidation within a larger downtrend. Prices tend to leave a symmetrical triangle in the same direction they entered.
What To Watch
The lower trendline on Chart 3 is the level to monitor. A sustained break below it on meaningful volume would shift the probability toward Bulkowski's most likely decline range of 10% to 19%. The apex date, May 27th, is the other marker. Price behavior around that date tends to be decisive.
I may be wrong, of course. Anomalies occur, fundamentals shift, so be cautious.
In case you haven’t noticed, I post various charts in the Substack notes every week. You can find them all here. (click on the link)
P.S.: My next update on the US indices lands around May 21st, 2026 - a followup on the May 10 and May 21–22 hotspots flagged in my post#303 - Wheels Within Wheels.
P.S.: Occasionally, I share new analyses exclusively for free subscribers. Subscribing gives you email updates on these posts, plus extra insights and deeper research from the time you join onward; past analyses are not included.
If you liked this post from @Fiorente2’s Blog, why not restack and share it?
© 2008–2026 Fiorente2.com. All Rights Reserved.
Disclaimer: This analysis is for informational and educational purposes only and should not be considered investment advice. Read our full disclaimer.
Disclosure: From time to time, I may hold positions in the securities mentioned.
Statistics from Encyclopedia of Chart Patterns, Thomas N. Bulkowski, 2000