Climbing up a wall of worries
#167 Reviewing the US Indices, Gold, Silver and IBM
Introduction
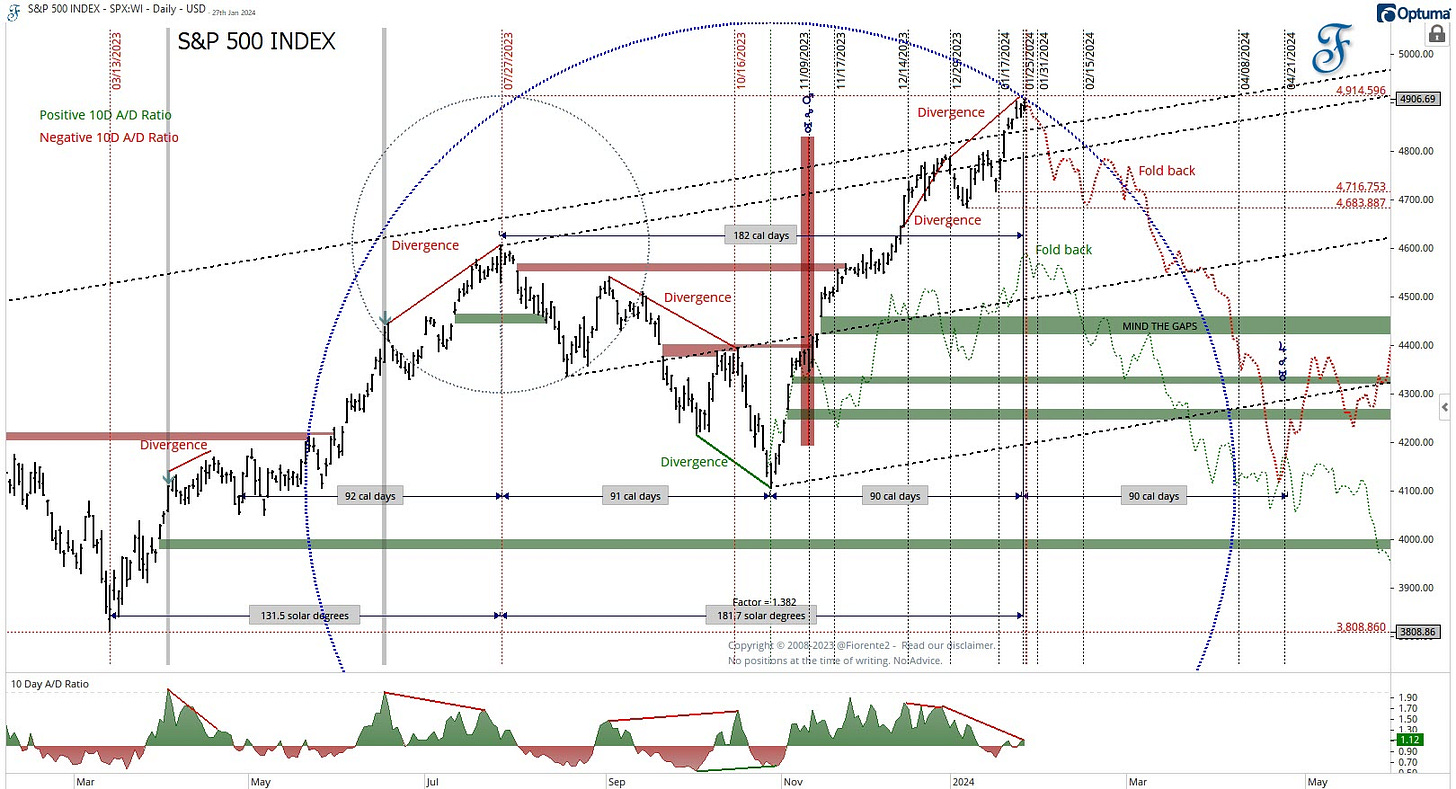
As discussed in last week’s post, I would not be surprised if the US Indices continue their uptrend until 180 degrees from July/August 2023 Top to January 29th, 2024 or even to the Chinese New Year date. We are closing in on these dates.
There are many other shorter and longer-term cycles that head into the same dates. Note it can take time for accumulation and distribution to take place before a reversal may happen.
Looking at the S&P 500 10-day Advance/Decline ratio and the diversion with the S&P 500, it seems as if the S&P 500 is reaching for a crest.
This signals that on a 10-day average, most of the stocks in the S&P 500 (SPX) actually do not seem to advance any further, nor a real decline has yet set in. We are possibly at the crossroads of a potential market turn, but no confirmation is seen yet. Hence, the foldback scenarios on the chart above are still preliminary.
In this weekly update for our premium subscribers(beyond the paywall), we will be covering the US Indices(DJIA, SPX, Nasdaq Composite & Nasdaq 100 Index), Gold, Silver & IBM
Don’t miss out on the latest Fiorente2 Stock Market Outlook 2024, a 55-page digital eBook publication that provides a comprehensive analysis of World Indices, Commodities, Gold, Silver, Oil, Wheat, Treasury Notes, and Crypto Currencies. The publication features fully back-tested Mass Pressure Index charts for each equity year ahead and is available for download on my Gumroad website.
This analysis is intended for general informational & educational purposes only. Hypothetical or simulated performance based on past cycles has many limitations. Cycles can contract, extend, and invert. Anomalies can occur. Hence, past performance is no guarantee for the future. No advice. Please take a look at our full disclaimer.


