
Are the Gann Master Cycles aligning?
A review on two of the most important Gann Master Time Factors

Introduction
On the November 26th the $DJIA fell 2.53% and the $S&P 500 2.27%. There are not many instances in the past 120 years that the indices fell that much on the day after Thanks Giving. This is another true Black Friday trading day.
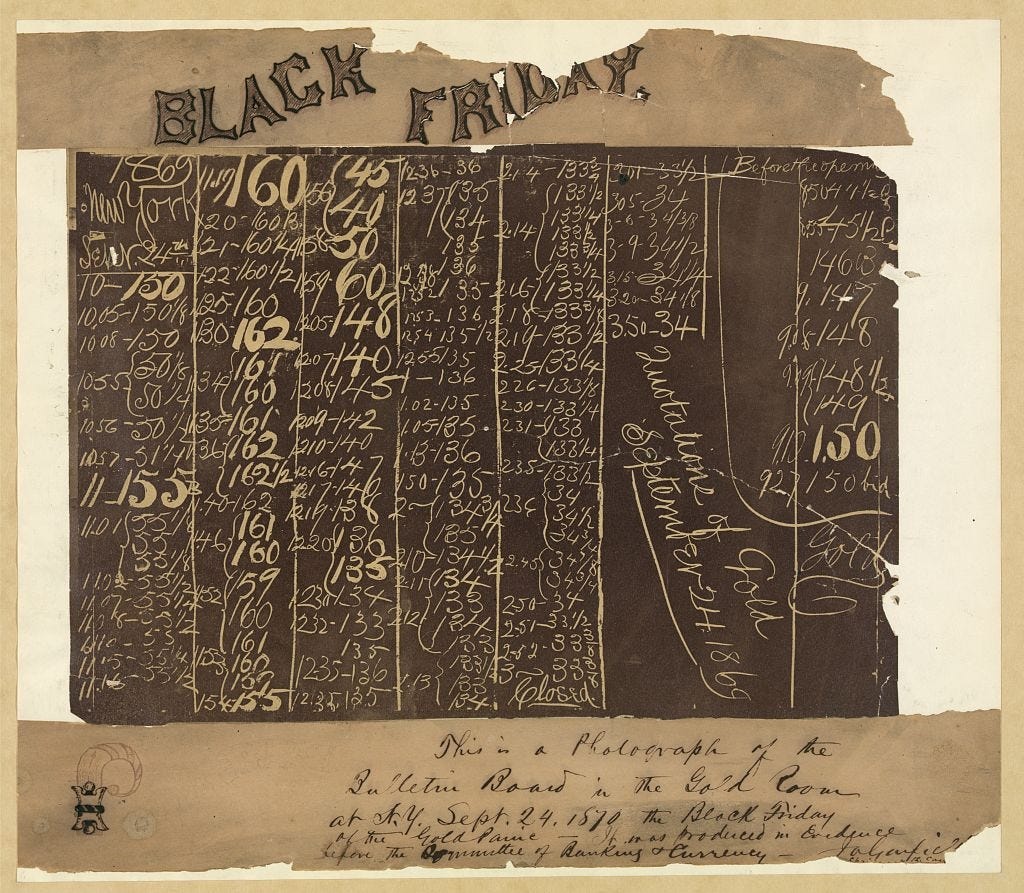
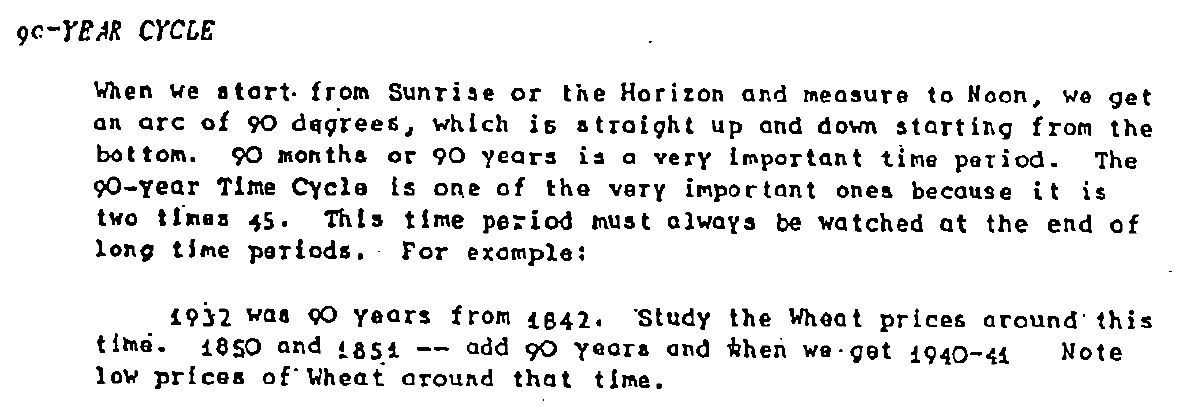
The above picture is from the first Black Friday mentioned in September 1870. But in 1918,1931, 1937 and 1979 there were similar down trends on the Friday(s) after Thanksgiving. The most striking and with the highest correlation might be the one from 1931. This reminded me of the Great Cycle (90 year cycle) that W.D. Gann mentioned in his Stock Market and Commodity courses.
Is the Great Cycle now aligning with the current market and the Gann Master Cycle we are following?
Comparing the Great Cycle and Gann Master Cycle
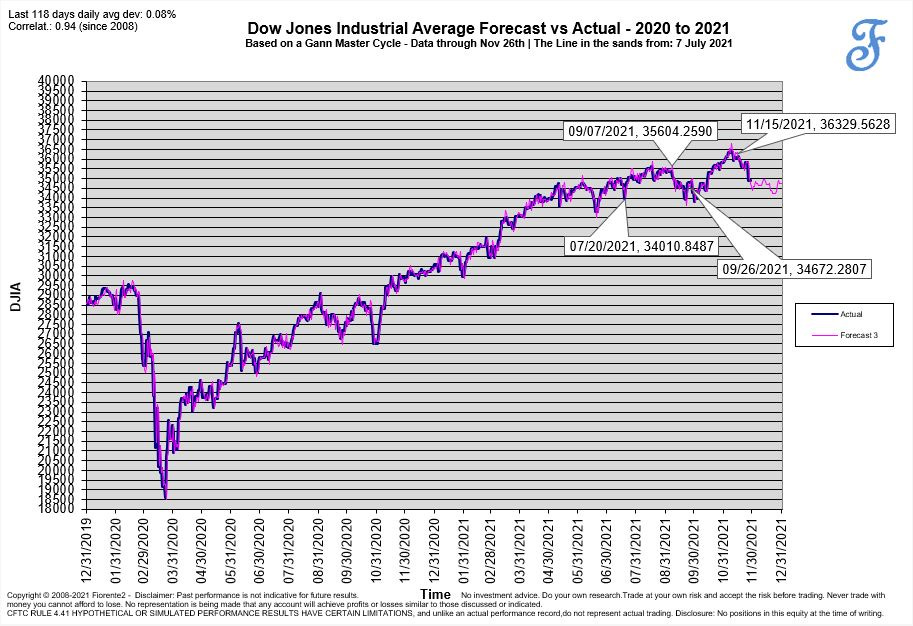
In todays market the Gann Master Cycle has been more accurate than the 90 year cycle this year. However since early October 2021 (or perhaps mid August 2021) the $DJIA seems to follow the same course as the 90 year cycle as you can see in below picture.
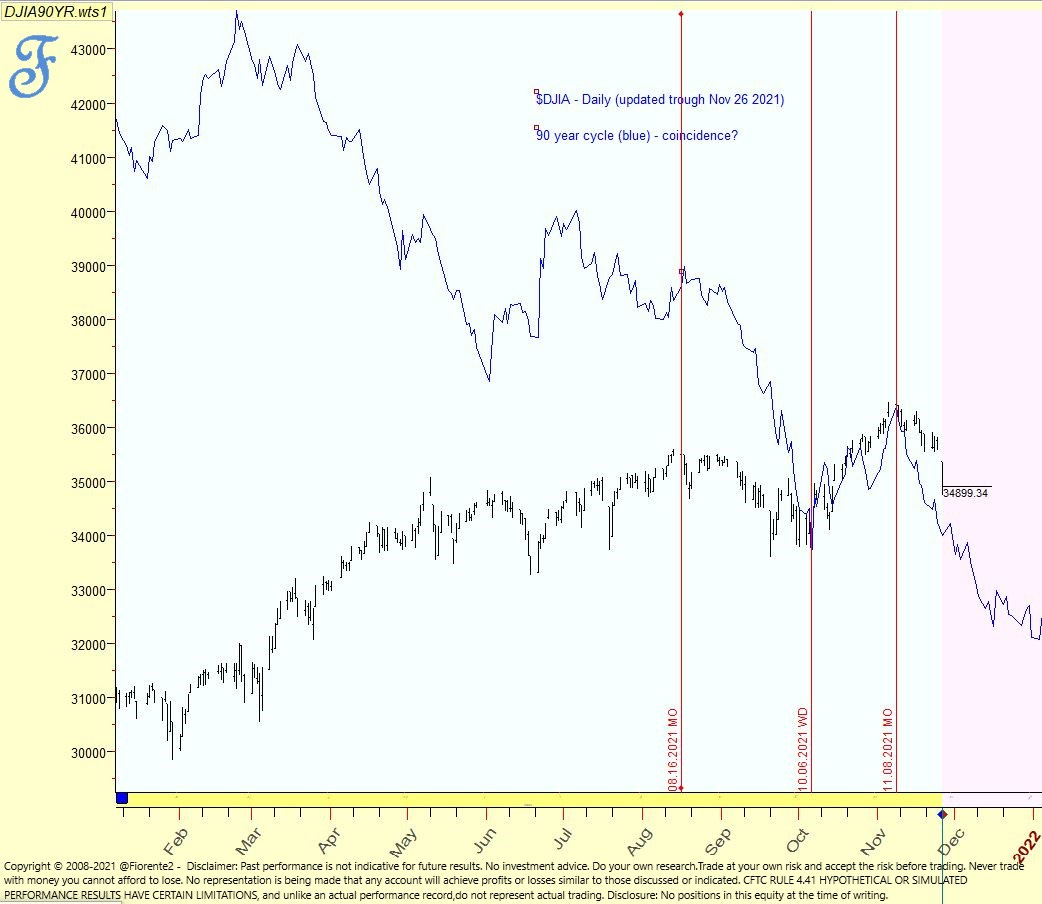
The timeframe is still too small to be of any statistical significance but we know from J.M. Hurst that cycles in the stock market seem to synchronize on troughs. This makes it interesting to follow how these cycles develop in the months to come. If there is a 90 year cycle in stocks we will probably see a bottom in the market somewhere in 2022 or early 2023, similar to 1932 and 1842.
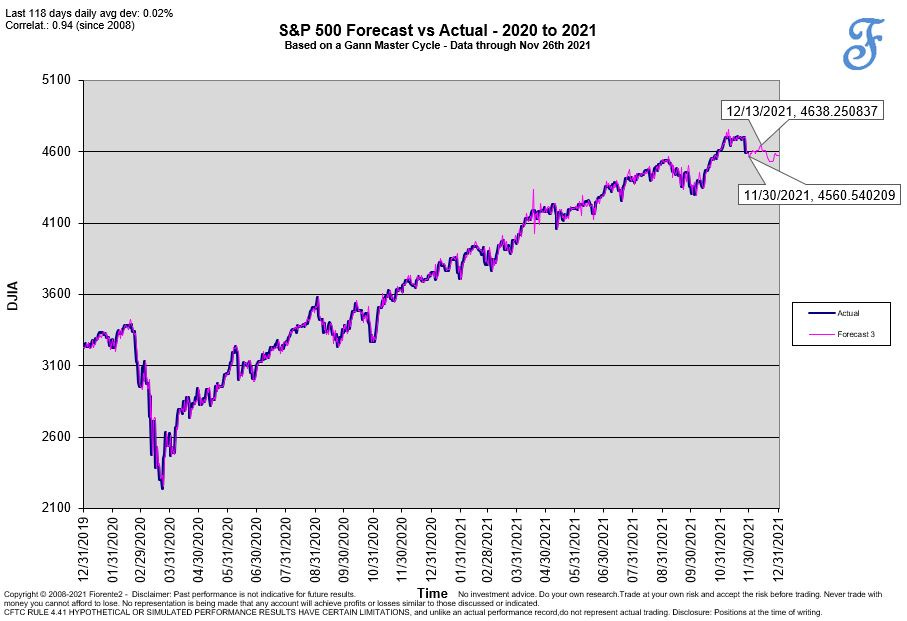
$SPX following the Gann Master Cycle
I have never published this before but next to the $DJIA the $S&P 500 is also following the Gann Master Cycle. This cycle is approximately 3x the Jupiter-Saturn cycle which Jupiter Saturn cycle is on average 19.86 years. You can call it a 60 year cycle or as W.D. Gann mentioned a Master Time Period.
The forecast for the $SPX - the S&P 500 index from last December 31st 2020 has been quite accurate both in time and price. Sometimes the forecast was leading and other times lagging but on the whole this was quite a leading indicator in 2021. The current price level is around the forecast made by this time. The Gann Master Cycle suggested a high for Dec 13th 2021 but this may have arrived earlier on November 22nd High, or on the 18th 2021 at the highest close instead.
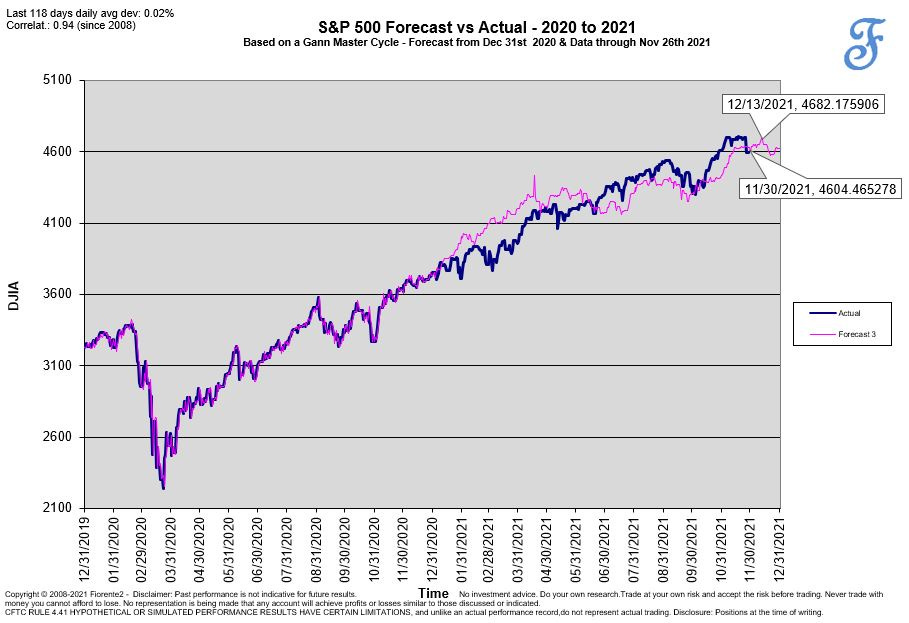
Although there is currently a 10% error in the amplitude compared to the previous cycle below forecast until the end of the year is in below chart.
If the Gann Master Cycle repeats we have probably already seen the high on November 8th for the $DJIA as well, see below dynamic chart.
We will have to watch if the Gann Master Cycle remains the dominant one, but I would not be surprised if the 90 year cycle will become more dominant going forward.
Accuracy of the Gann Master Cycle
Measured over a long period the correlation since 2008 of the Gann Master Cycle has been quite stunning. I have been following this cycle as my main indicator for market direction. My analysis on the Gann Master cycle shows period’s of time in which the Gann Master cycle is less accurate than on other times. From time to time this cycle can invert, contract or extend due to some factors which is the probable cause of the accuracy differences over time as you can see on below graphs for the $DJIA and $SPX.
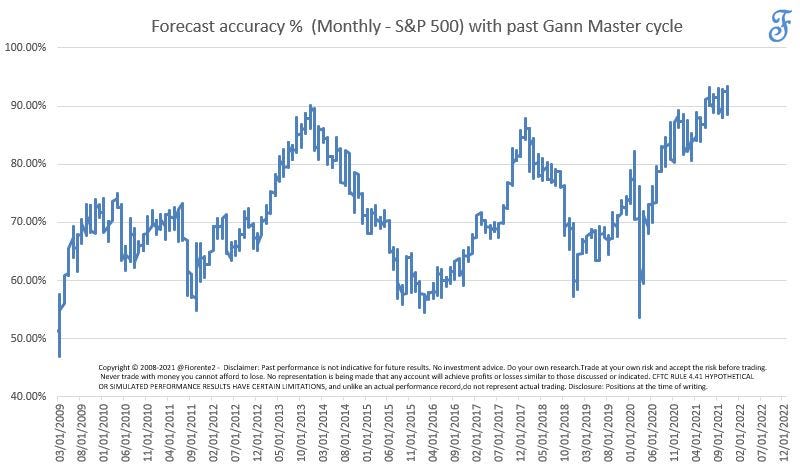
Recently the accuracy for the $SPX has been higher than for the $DJIA as you can see in below analysis.
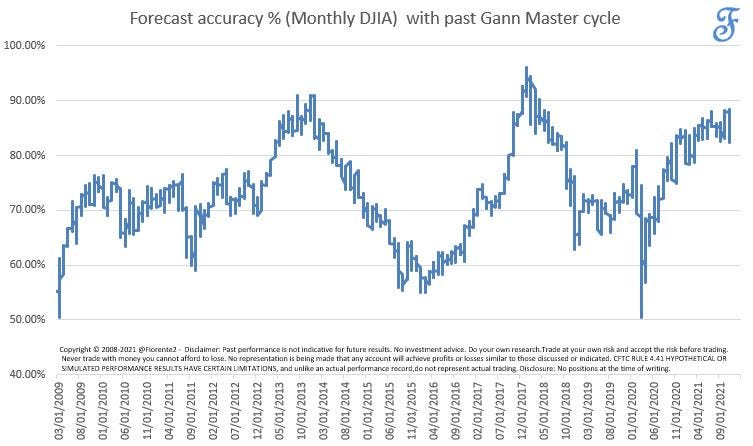
But at all times highs and lows were made on similar moments in time for both the $DJIA and the $S&P 500.
If we are unfolding master cycles like the 90 year and 60 year cycle at the same time this might add to the volatility and the significance of the down turn to be expected. This could to lead to even higher accuracy than measured in the last 13 years
Conclusion
Both the $DJIA and the $S&P 500 seem to follow the two greatest of cycles W.D. Gann wrote about. Which ever cycle is/becomes the more dominant we will have to see. There may be other cycles in play as well and the interaction between all cycles will eventually determine the course the market will take. Only in 25920 years the planetary circumstances are the same (but we will never know). So, do not trade the forecast but the actual chart and market data in front of you.
Let me know what you think is likely to happen going forward and share your thoughts in below comment section.
Disclosure: Holding positions at the time of writing. Read our full disclaimer.
Market Outlook 2022
In the Market Outlook 2022 I will publish more on the cycles mentioned in this post including an exclusive Dynamic Master Cycle forecast on the Nasdaq.
Currently Fiorente’s Stock Market Outlook for 2022 is set for the first 333 subscribers at $34 (USD) excl. VAT and credit card fees (when applicable). I am planning to offer an optional monthly or quarterly update as well for an additional small fee for those who have bought the yearly publication.
So, subscribe to my newsletter and send me an email in reply to this post or email if your are interested in this publication.
Please count me in on your 2022 forecast
hello sir... I am interested in this publication please