

Introduction
With ongoing turmoil in the world, one might think that gold would continue its bullish trend. Let’s look at gold’s long-term and short-term trends to see where we stand and where future inflection points might be. Are you bullish or bearish on gold?

Gold - Long Term Trend
Gold has been in a long-term uptrend but may have encountered resistance in both price and time at the end of January 2026, which is 49 years from the 1976 low, 5262 calendar days from the September 2011 high (on a 1x1 timing line from zero this is very close to the actual price level reached), and 90 months from the August 2018 low.
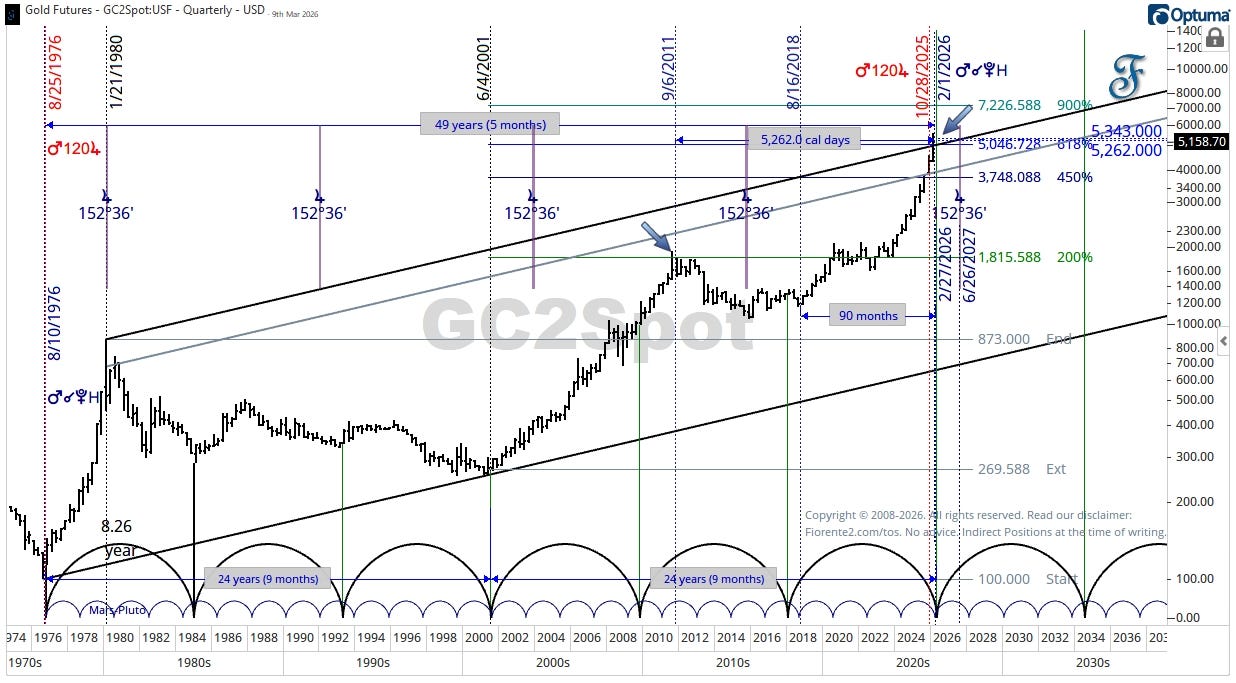
This was also on the date when Mars was at the same degree (conjunct) Pluto from a helio perspective.
Although Gold is trading at the upper 1x1 timing line, it does not mean it cannot finally break through these levels, but I expect Gold may pause now.
Gold - Shorter Term Trend
In the short term, I expect gold to trade within this nearly symmetrical triangle. Notice how gold pulled back and bounced off the Saturn planetary timing lines.
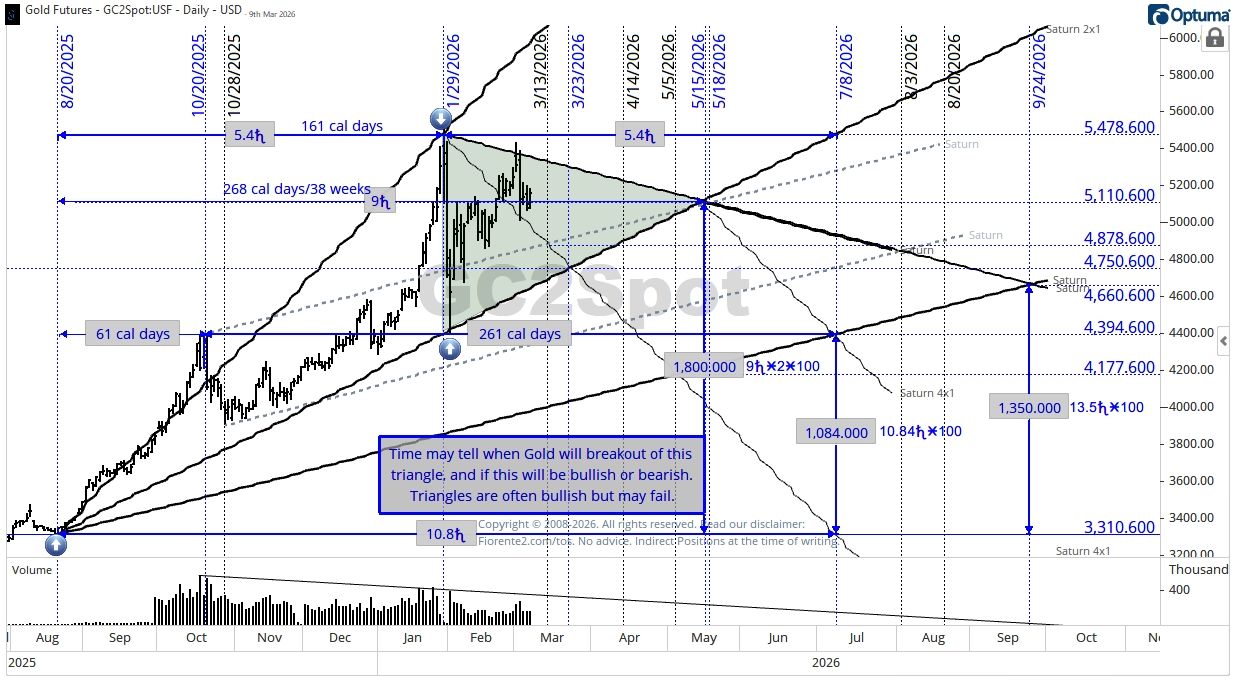
I have drawn the triangle using Saturn Helio timing lines, which indicate where Saturn might be positioned if traded at a 1x1 ratio ($100/degree), a 2x1 ratio, and a 4x1 ratio, based on relevant peaks and troughs. When price touches these lines, it signifies a balance between price and time, and trend changes or continuations often happen at these points.
Using Saturn (also known as ‘Father Time’), one can easily determine price and time targets. Note the calculations on the chart. I usually observe the crossovers of various lines drawn from the trough or peak, where inflection point may occur. These intersections serve as hotspots where price and time may align.
The intersection of the 1x1 from the top (Jan 2026) and the 2x1 from the bottom (August 2025) appears to be a significant point in time and price (mid-May 2026).
The breakout direction is unknown ahead of Time. As mentioned on the chart, triangles can break out either downward or upward and are usually seen as short-term consolidations lasting up to 3 months. Triangles can also have multiple premature breakouts on lower volume and may pull back or throw back the breakout within the triangle at a later time.
As an additional confirming indicator, you can always look for volume outbreaks. Volume usually declines throughout the consolidation phase, and is often very low before the breakout.
So far, the volume has been declining. Using a 1-bar ATR can also easily spot breakouts. For more on triangles, read Thomas Bulkowski’s Encyclopedia of Chart Patterns.
Conclusion
Time may tell when Gold will break out in a bullish or bearish stance. It can go either way in the next few months. This is my current bias on Gold for now.
Remember, cycles can contract, extend, and invert. I may be wrong, of course. Anomalies can occur, fundamentals can shift, so be cautious. I expect some significant volatility ahead.
In case you haven’t noticed, I post various charts in the Substack notes every week. You can find them all here. (click on the link)
P.S.: Occasionally, I share new analyses exclusively for free subscribers. Subscribing gives you email updates on these posts, plus extra insights and deeper research from the time you join onward; past analyses are not included.
If you liked this post from @Fiorente2’s Blog, why not restack and share it?
© 2008–2026 Fiorente2.com. All Rights Reserved.
Disclaimer: This analysis is for informational and educational purposes only and should not be considered investment advice. Read our full disclaimer.
Disclosure: From time to time, I may hold positions in the securities mentioned.