
A Longer-Term View on US Indices
#236 An update on the US Indices: Nasdaq, S&P500 and DJIA.

I am taking a longer-term perspective on the US indices in this week's post. The S&P 500 recently reached the 1.618% Fibonacci extension line, which has created substantial resistance over the past few months.
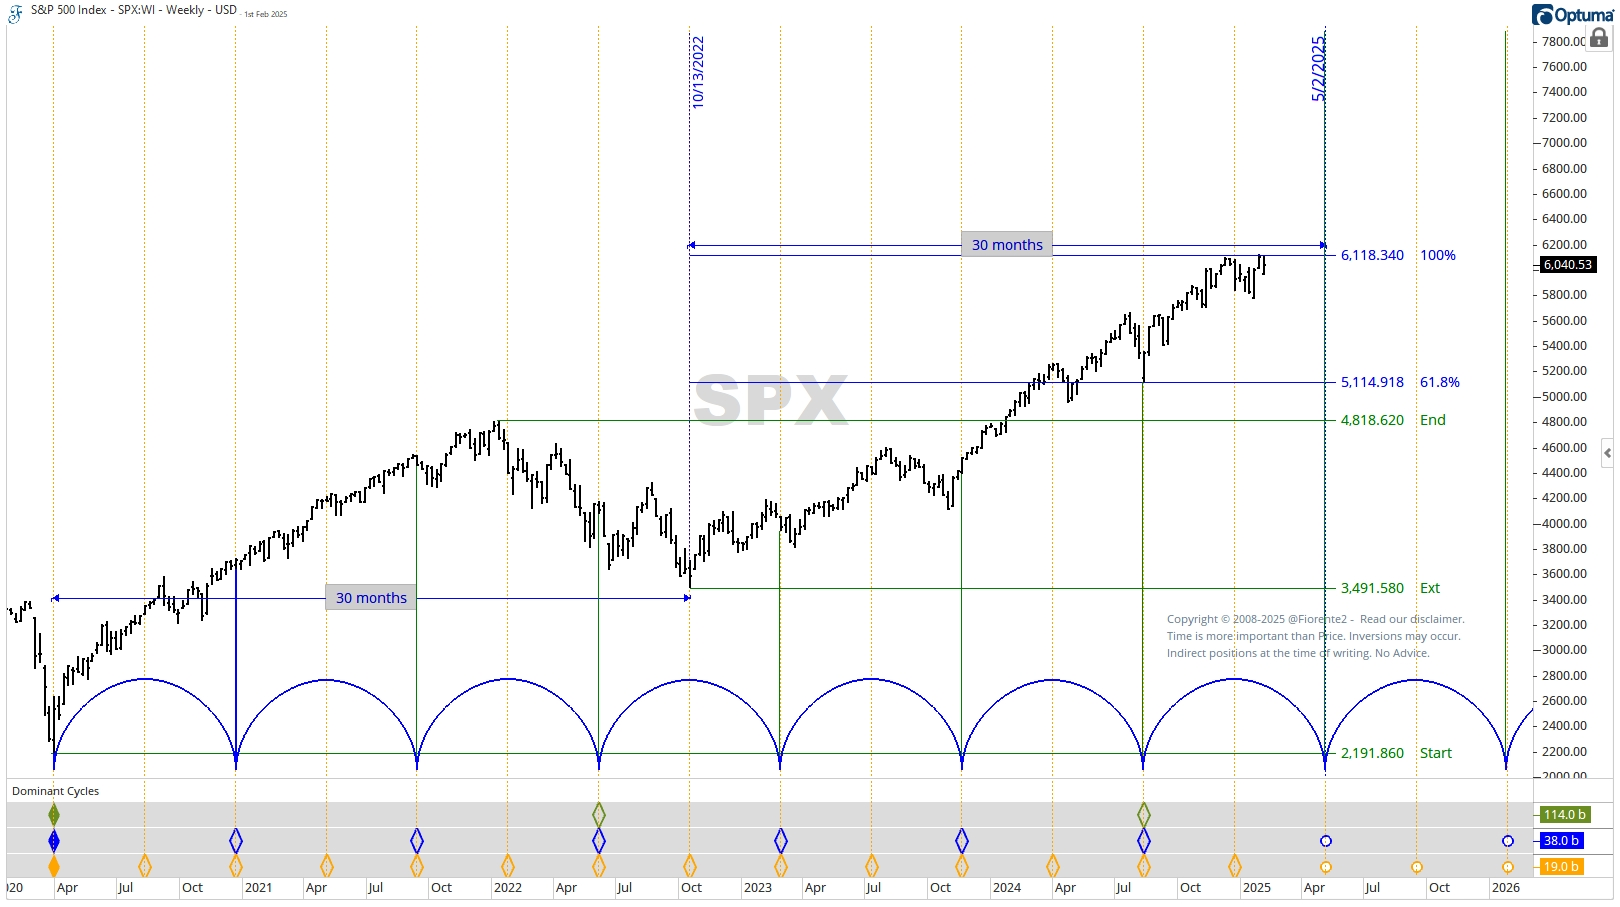
Dominant time cycles suggest the S&P 500 may reach a 30-month low by May 2025. However, a low-to-low-to-high sequence (from the March 2020 low to the October 2022 low, culminating in a May 2025 high) could also occur. This scenario may align better with the 60-year cycle high.
In this week’s post, I am reviewing time cycles on the US indices using the Hurst dominant cycle methodology along with Gann’s approach to squaring Price and Time. Gann noticed that price and time are interchangeable and that you can find the next important significant inflection point using a significant high, low, or even a price range between important inflection points. In examining the planetary cycles of Jupiter and Saturn, which offer a more approximate view of the 60-year master cycle, we will explore how the US Indices may unfold over the next two years.